29
/
en
AIzaSyAYiBZKx7MnpbEhh9jyipgxe19OcubqV5w
April 1, 2024
258094
Syrian Arab Republic
SYR
true
2
1
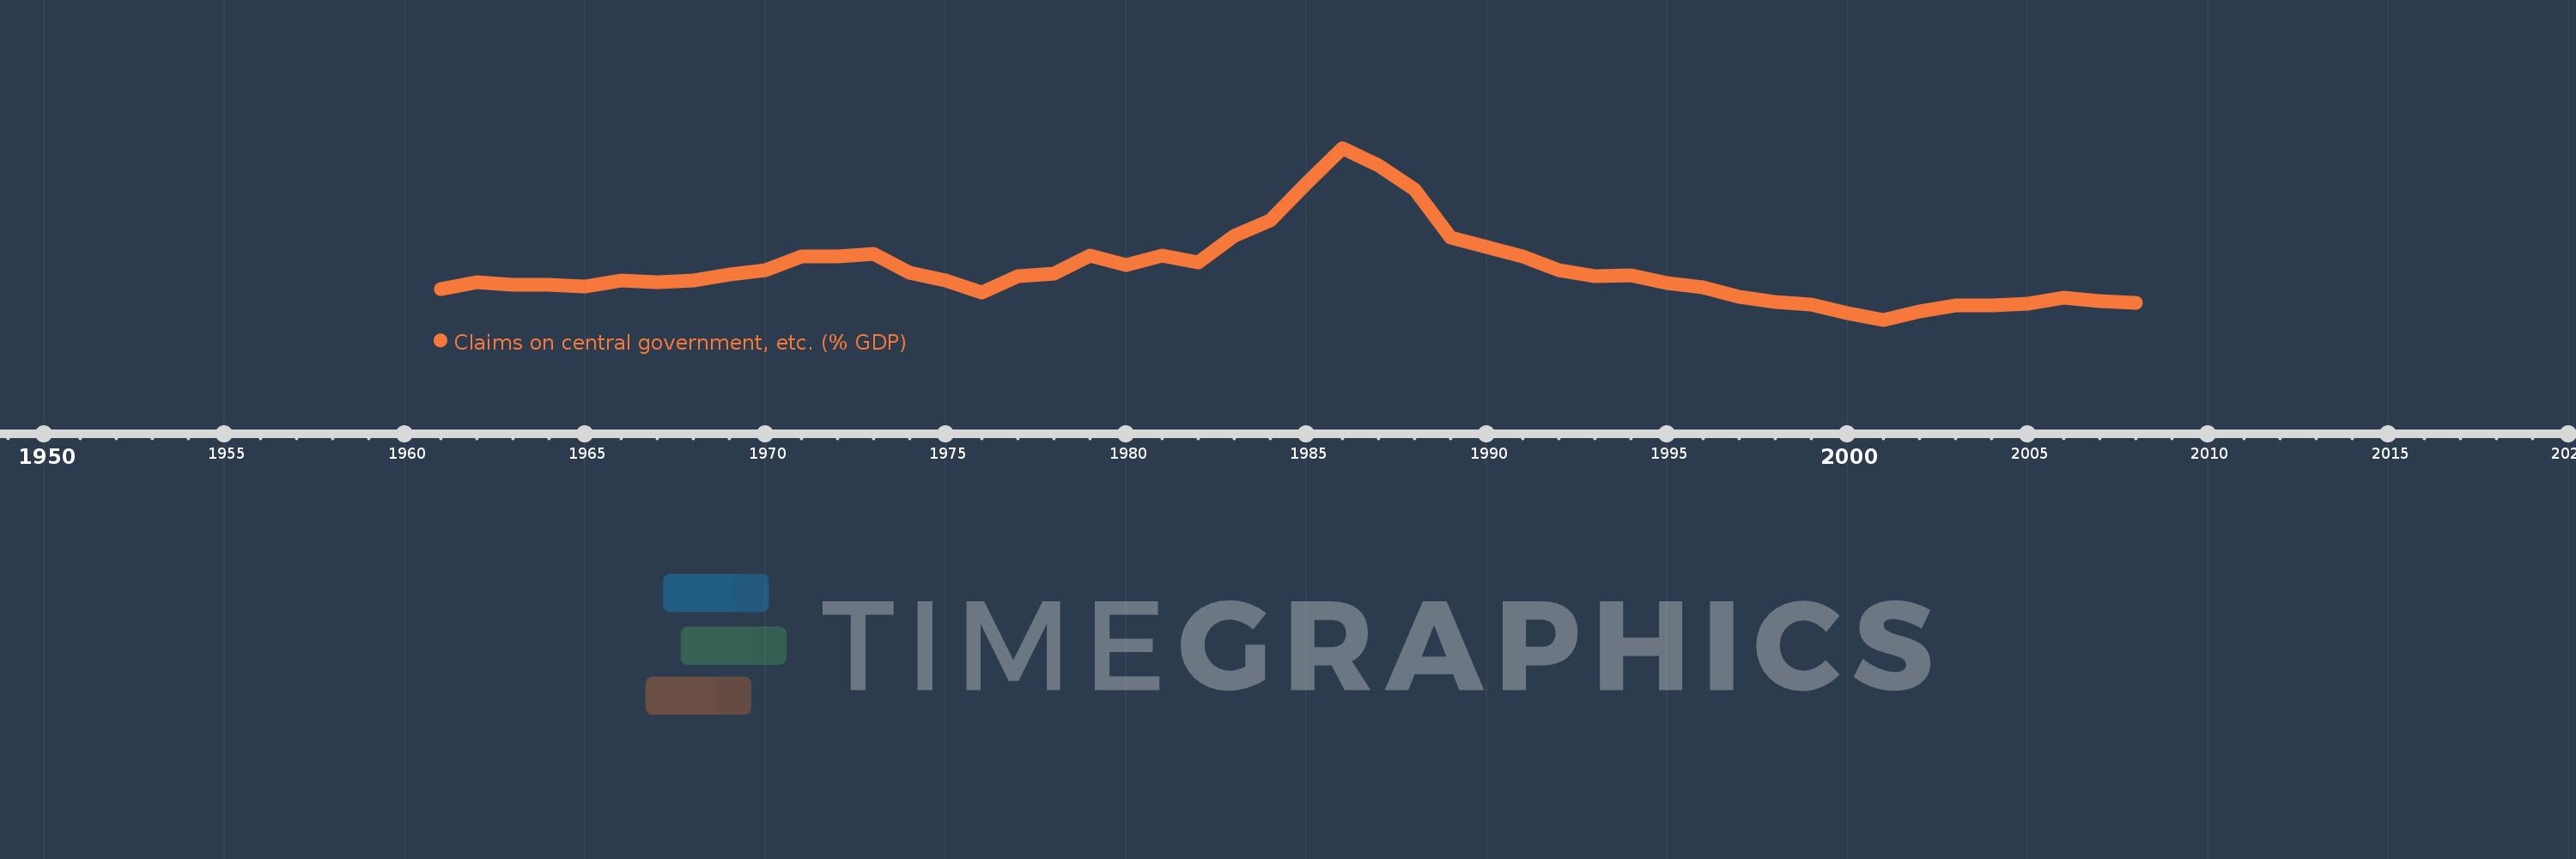
Claims on central government, etc. (% GDP)
2008,2007,2006,2005,2004,2003,2002,2001,2000,1999,1998,1997,1996,1995,1994,1993,1992,1991,1990,1989,1988,1987,1986,1985,1984,1983,1982,1981,1980,1979,1978,1977,1976,1975,1974,1973,1972,1971,1970,1969,1968,1967,1966,1965,1964,1963,1962,1961
This statistics in other country:
AfghanistanAlbaniaAlgeriaAngolaAntigua and BarbudaArab WorldArgentinaArmeniaArubaAustraliaAustriaAzerbaijanBahamas, TheBahrainBangladeshBarbadosBelarusBelgiumBelizeBeninBhutanBoliviaBosnia and HerzegovinaBotswanaBrazilBrunei DarussalamBulgariaBurkina FasoBurundiCabo VerdeCambodiaCameroonCanadaCaribbean small statesCentral African RepublicCentral Europe and the BalticsChadChileChinaColombiaComorosCongo, Dem. Rep.Congo, Rep.Costa RicaCote d'IvoireCroatiaCyprusCzech RepublicDenmarkDjiboutiDominicaDominican RepublicEarly-demographic dividendEast Asia & PacificEast Asia & Pacific (excluding high income)East Asia & Pacific (IDA & IBRD countries)EcuadorEgypt, Arab Rep.El SalvadorEquatorial GuineaEritreaEstoniaEthiopiaEuro areaEurope & Central AsiaEurope & Central Asia (excluding high income)Europe & Central Asia (IDA & IBRD countries)European UnionFijiFinlandFragile and conflict affected situationsFranceGabonGambia, TheGeorgiaGermanyGhanaGreeceGrenadaGuatemalaGuineaGuinea-BissauGuyanaHaitiHeavily indebted poor countries (HIPC)High incomeHondurasHong Kong SAR, ChinaHungaryIBRD onlyIcelandIDA & IBRD totalIDA blendIDA onlyIDA totalIndiaIndonesiaIran, Islamic Rep.IraqIrelandIsraelItalyJamaicaJapanJordanKazakhstanKenyaKorea, Rep.KosovoKuwaitKyrgyz RepublicLao PDRLate-demographic dividendLatin America & Caribbean Latin America & Caribbean (excluding high income)Latin America & the Caribbean (IDA & IBRD countries)LatviaLeast developed countries: UN classificationLebanonLesothoLiberiaLibyaLithuaniaLow & middle incomeLow incomeLower middle incomeLuxembourgMacao SAR, ChinaMacedonia, FYRMadagascarMalawiMalaysiaMaldivesMaliMaltaMauritaniaMauritiusMexicoMicronesia, Fed. Sts.Middle East & North AfricaMiddle East & North Africa (excluding high income)Middle East & North Africa (IDA & IBRD countries)Middle incomeMoldovaMongoliaMontenegroMoroccoMozambiqueMyanmarNamibiaNepalNetherlandsNew ZealandNicaraguaNigerNigeriaNorth AmericaNorwayOECD membersOmanOther small statesPacific island small statesPakistanPanamaPapua New GuineaParaguayPeruPhilippinesPolandPortugalPost-demographic dividendPre-demographic dividendQatarRomaniaRussian FederationRwandaSamoaSao Tome and PrincipeSaudi ArabiaSenegalSerbiaSeychellesSierra LeoneSingaporeSlovak RepublicSloveniaSmall statesSolomon IslandsSouth AfricaSouth AsiaSouth Asia (IDA & IBRD)South SudanSpainSri LankaSt. Kitts and NevisSt. LuciaSt. Vincent and the GrenadinesSub-Saharan Africa Sub-Saharan Africa (excluding high income)Sub-Saharan Africa (IDA & IBRD countries)SudanSurinameSwazilandSwedenSwitzerlandSyrian Arab RepublicTajikistanTanzaniaThailandTimor-LesteTogoTongaTrinidad and TobagoTunisiaTurkeyUgandaUkraineUnited Arab EmiratesUnited KingdomUnited StatesUpper middle incomeUruguayVanuatuVenezuela, RBVietnamWest Bank and GazaWorldYemen, Rep.ZambiaZimbabwe Timeline:
This timeline shows a graph from 1961 to 2008 of Syrian Arab Republic. No data until 1960. Number of actual observations by date: 48.
Source name:
World Development Indicators
Source organization:
International Monetary Fund, International Financial Statistics and data files, and World Bank and OECD GDP estimates.
Categories, topics:
Financial Sector
Last updated:
apr 23, 2017
Indicators value changes by year
Minimum:
-3.114
jan 1, 2001
At the date of observation
Value
Absolute change
Change from previous value
jan 1, 1961
11.402
+11.402
0.0%
jan 1, 1962
14.826
+3.424
30.03%
jan 1, 1963
13.536
-1.29
-8.7%
jan 1, 1964
13.597
+0.061
0.45%
jan 1, 1965
12.973
-0.624
-4.59%
jan 1, 1966
15.642
+2.669
20.57%
jan 1, 1967
14.967
-0.674
-4.31%
jan 1, 1968
15.782
+0.815
5.45%
jan 1, 1969
18.604
+2.822
17.88%
jan 1, 1970
20.388
+1.783
9.59%
jan 1, 1971
27.288
+6.901
33.85%
jan 1, 1972
27.066
-0.222
-0.81%
jan 1, 1973
28.495
+1.429
5.28%
jan 1, 1974
19.251
-9.244
-32.44%
jan 1, 1975
15.806
-3.444
-17.89%
jan 1, 1976
9.965
-5.842
-36.96%
jan 1, 1977
17.828
+7.864
78.92%
jan 1, 1978
18.964
+1.136
6.37%
jan 1, 1979
27.619
+8.655
45.64%
jan 1, 1980
23.107
-4.513
-16.34%
jan 1, 1981
27.384
+4.277
18.51%
jan 1, 1982
24.085
-3.298
-12.04%
jan 1, 1983
37.182
+13.096
54.37%
jan 1, 1984
44.412
+7.23
19.45%
jan 1, 1985
62.2
+17.788
40.05%
jan 1, 1986
79.04
+16.839
27.07%
jan 1, 1987
70.686
-8.354
-10.57%
jan 1, 1988
59.173
-11.513
-16.29%
jan 1, 1989
36.328
-22.845
-38.61%
jan 1, 1990
31.557
-4.771
-13.13%
jan 1, 1991
27.077
-4.48
-14.2%
jan 1, 1992
20.428
-6.649
-24.55%
jan 1, 1993
17.78
-2.648
-12.96%
jan 1, 1994
18.205
+0.425
2.39%
jan 1, 1995
14.452
-3.753
-20.61%
jan 1, 1996
12.454
-1.998
-13.82%
jan 1, 1997
7.975
-4.48
-35.97%
jan 1, 1998
5.188
-2.786
-34.94%
jan 1, 1999
4.261
-0.928
-17.88%
jan 1, 2000
0.003
-4.257
-99.92%
jan 1, 2001
-3.114
-3.118
-89.92K%
jan 1, 2002
0.893
+4.007
-128.68%
jan 1, 2003
3.546
+2.653
297.1%
jan 1, 2004
3.881
+0.335
9.44%
jan 1, 2005
4.491
+0.61
15.71%
jan 1, 2006
7.261
+2.77
61.69%
jan 1, 2007
5.809
-1.451
-19.99%
jan 1, 2008
4.813
-0.996
-17.14%
Ranking of countries by current statistics by years


Comments: