29
/
en
AIzaSyAYiBZKx7MnpbEhh9jyipgxe19OcubqV5w
April 1, 2024
58763
Sub-Saharan Africa
SSF
false
2
1
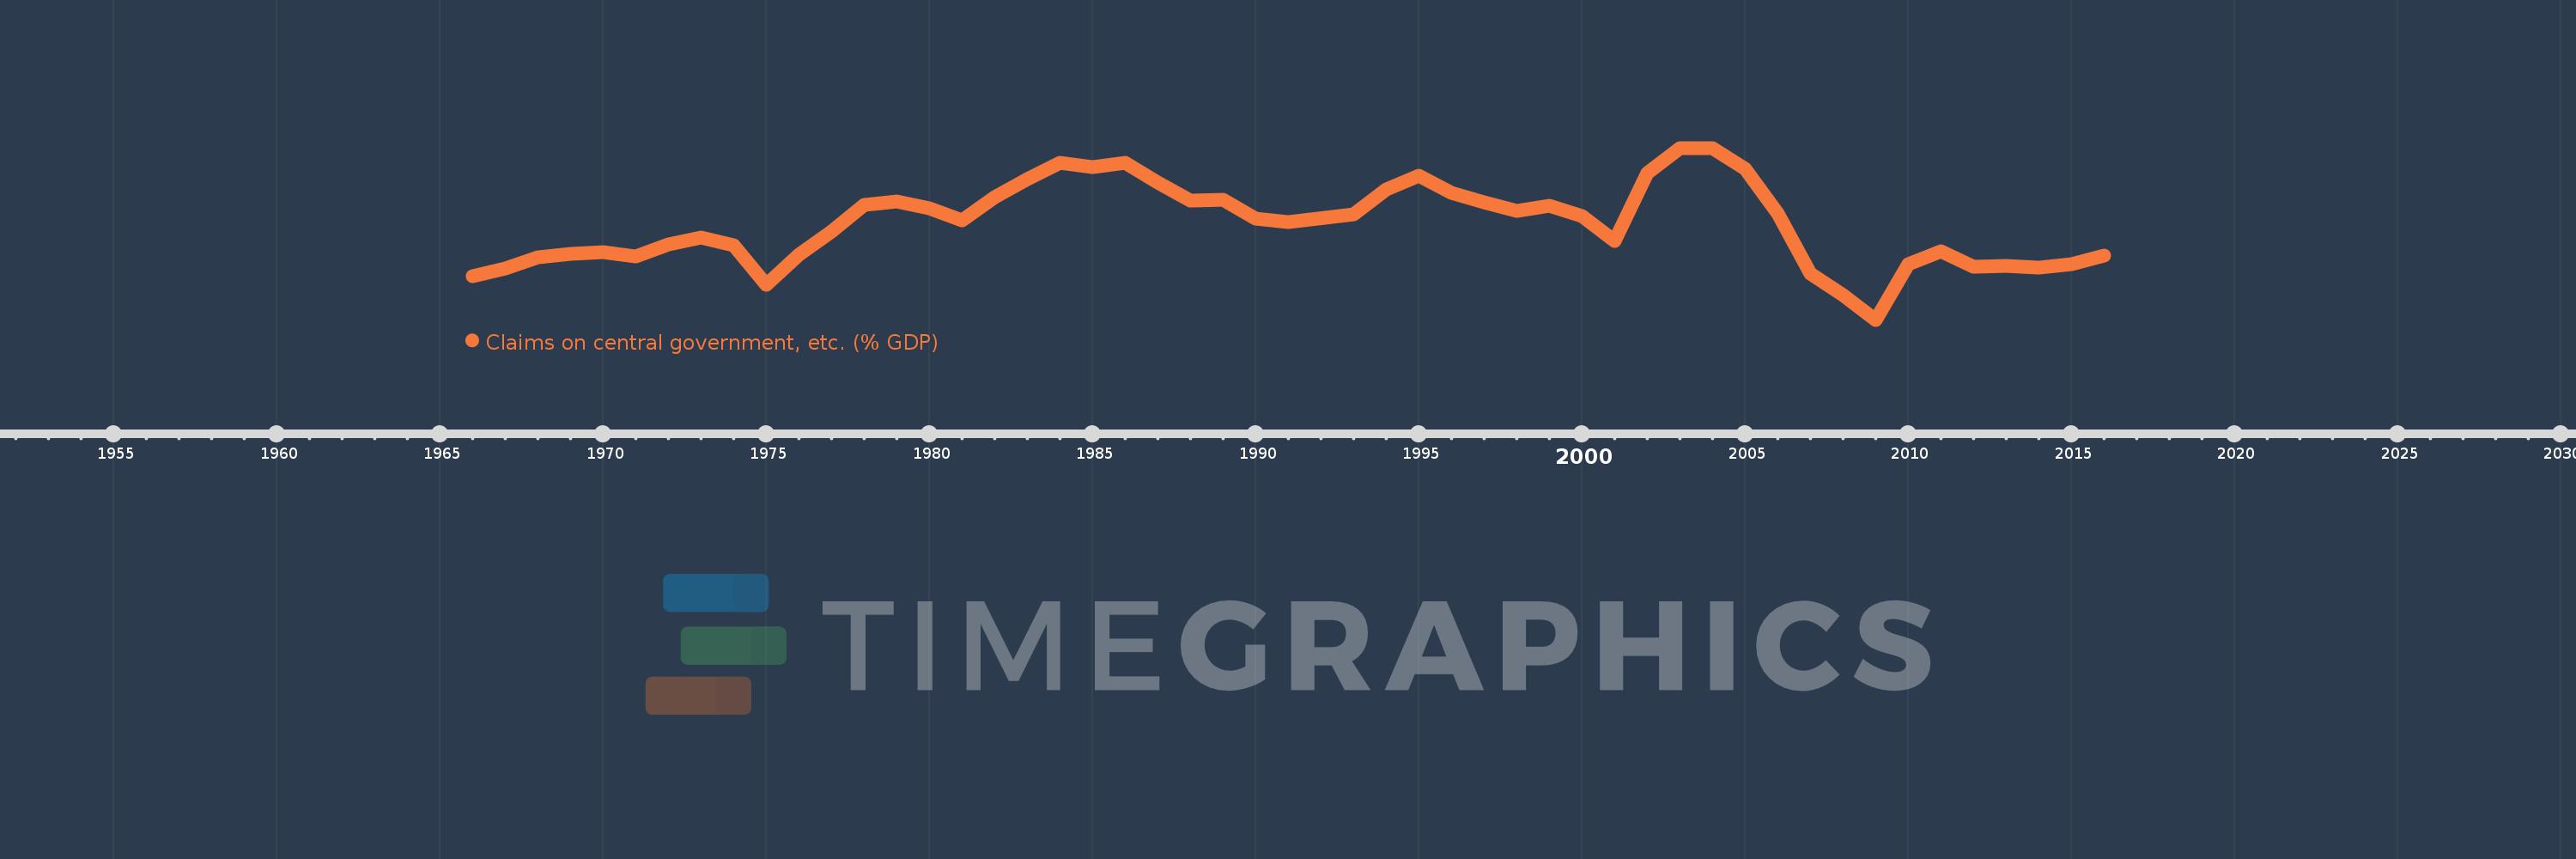
Claims on central government, etc. (% GDP)
2016,2015,2014,2013,2012,2011,2010,2009,2008,2007,2006,2005,2004,2003,2002,2001,2000,1999,1998,1997,1996,1995,1994,1993,1991,1990,1989,1988,1987,1986,1985,1984,1983,1982,1981,1980,1979,1978,1977,1976,1975,1974,1973,1972,1971,1970,1969,1968,1967,1966
This statistics in other country:
AfghanistanAlbaniaAlgeriaAngolaAntigua and BarbudaArab WorldArgentinaArmeniaArubaAustraliaAustriaAzerbaijanBahamas, TheBahrainBangladeshBarbadosBelarusBelgiumBelizeBeninBhutanBoliviaBosnia and HerzegovinaBotswanaBrazilBrunei DarussalamBulgariaBurkina FasoBurundiCabo VerdeCambodiaCameroonCanadaCaribbean small statesCentral African RepublicCentral Europe and the BalticsChadChileChinaColombiaComorosCongo, Dem. Rep.Congo, Rep.Costa RicaCote d'IvoireCroatiaCyprusCzech RepublicDenmarkDjiboutiDominicaDominican RepublicEarly-demographic dividendEast Asia & PacificEast Asia & Pacific (excluding high income)East Asia & Pacific (IDA & IBRD countries)EcuadorEgypt, Arab Rep.El SalvadorEquatorial GuineaEritreaEstoniaEthiopiaEuro areaEurope & Central AsiaEurope & Central Asia (excluding high income)Europe & Central Asia (IDA & IBRD countries)European UnionFijiFinlandFragile and conflict affected situationsFranceGabonGambia, TheGeorgiaGermanyGhanaGreeceGrenadaGuatemalaGuineaGuinea-BissauGuyanaHaitiHeavily indebted poor countries (HIPC)High incomeHondurasHong Kong SAR, ChinaHungaryIBRD onlyIcelandIDA & IBRD totalIDA blendIDA onlyIDA totalIndiaIndonesiaIran, Islamic Rep.IraqIrelandIsraelItalyJamaicaJapanJordanKazakhstanKenyaKorea, Rep.KosovoKuwaitKyrgyz RepublicLao PDRLate-demographic dividendLatin America & Caribbean Latin America & Caribbean (excluding high income)Latin America & the Caribbean (IDA & IBRD countries)LatviaLeast developed countries: UN classificationLebanonLesothoLiberiaLibyaLithuaniaLow & middle incomeLow incomeLower middle incomeLuxembourgMacao SAR, ChinaMacedonia, FYRMadagascarMalawiMalaysiaMaldivesMaliMaltaMauritaniaMauritiusMexicoMicronesia, Fed. Sts.Middle East & North AfricaMiddle East & North Africa (excluding high income)Middle East & North Africa (IDA & IBRD countries)Middle incomeMoldovaMongoliaMontenegroMoroccoMozambiqueMyanmarNamibiaNepalNetherlandsNew ZealandNicaraguaNigerNigeriaNorth AmericaNorwayOECD membersOmanOther small statesPacific island small statesPakistanPanamaPapua New GuineaParaguayPeruPhilippinesPolandPortugalPost-demographic dividendPre-demographic dividendQatarRomaniaRussian FederationRwandaSamoaSao Tome and PrincipeSaudi ArabiaSenegalSerbiaSeychellesSierra LeoneSingaporeSlovak RepublicSloveniaSmall statesSolomon IslandsSouth AfricaSouth AsiaSouth Asia (IDA & IBRD)South SudanSpainSri LankaSt. Kitts and NevisSt. LuciaSt. Vincent and the GrenadinesSub-Saharan Africa Sub-Saharan Africa (excluding high income)Sub-Saharan Africa (IDA & IBRD countries)SudanSurinameSwazilandSwedenSwitzerlandSyrian Arab RepublicTajikistanTanzaniaThailandTimor-LesteTogoTongaTrinidad and TobagoTunisiaTurkeyUgandaUkraineUnited Arab EmiratesUnited KingdomUnited StatesUpper middle incomeUruguayVanuatuVenezuela, RBVietnamWest Bank and GazaWorldYemen, Rep.ZambiaZimbabwe Timeline:
This timeline shows a graph from 1966 to 2016 of Sub-Saharan Africa . No data until 1965. Number of actual observations by date: 50.
Source name:
World Development Indicators
Source organization:
International Monetary Fund, International Financial Statistics and data files, and World Bank and OECD GDP estimates.
Categories, topics:
Financial Sector
Last updated:
apr 23, 2017
Indicators value changes by year
Maximum:
15.791
jan 1, 2004
At the date of observation
Value
Absolute change
Change from previous value
jan 1, 1966
5.057
+5.057
0.0%
jan 1, 1967
5.718
+0.661
13.08%
jan 1, 1968
6.668
+0.95
16.61%
jan 1, 1969
6.966
+0.298
4.47%
jan 1, 1970
7.113
+0.147
2.11%
jan 1, 1971
6.702
-0.411
-5.78%
jan 1, 1972
7.724
+1.021
15.24%
jan 1, 1973
8.323
+0.599
7.76%
jan 1, 1974
7.689
-0.634
-7.62%
jan 1, 1975
4.353
-3.335
-43.38%
jan 1, 1976
6.864
+2.511
57.67%
jan 1, 1977
8.783
+1.92
27.97%
jan 1, 1978
11.062
+2.278
25.94%
jan 1, 1979
11.315
+0.253
2.29%
jan 1, 1980
10.725
-0.59
-5.22%
jan 1, 1981
9.718
-1.007
-9.39%
jan 1, 1982
11.699
+1.981
20.38%
jan 1, 1983
13.203
+1.504
12.86%
jan 1, 1984
14.551
+1.348
10.21%
jan 1, 1985
14.215
-0.336
-2.31%
jan 1, 1986
14.527
+0.312
2.19%
jan 1, 1987
12.912
-1.615
-11.12%
jan 1, 1988
11.422
-1.49
-11.54%
jan 1, 1989
11.44
+0.018
0.16%
jan 1, 1990
9.878
-1.562
-13.65%
jan 1, 1991
9.617
-0.261
-2.65%
jan 1, 1993
10.254
+0.637
6.63%
jan 1, 1994
12.293
+2.039
19.89%
jan 1, 1995
13.496
+1.203
9.78%
jan 1, 1996
12.03
-1.466
-10.86%
jan 1, 1997
11.282
-0.747
-6.21%
jan 1, 1998
10.533
-0.75
-6.65%
jan 1, 1999
10.99
+0.457
4.34%
jan 1, 2000
10.094
-0.896
-8.15%
jan 1, 2001
7.987
-2.107
-20.88%
jan 1, 2002
13.669
+5.682
71.14%
jan 1, 2003
15.772
+2.103
15.39%
jan 1, 2004
15.791
+0.019
0.12%
jan 1, 2005
14.037
-1.754
-11.11%
jan 1, 2006
10.301
-3.736
-26.61%
jan 1, 2007
5.266
-5.035
-48.88%
jan 1, 2008
3.494
-1.772
-33.64%
jan 1, 2009
1.445
-2.05
-58.65%
jan 1, 2010
6.121
+4.676
323.67%
jan 1, 2011
7.194
+1.073
17.54%
jan 1, 2012
5.869
-1.325
-18.42%
jan 1, 2013
5.944
+0.075
1.28%
jan 1, 2014
5.793
-0.151
-2.54%
jan 1, 2015
6.07
+0.277
4.78%
jan 1, 2016
6.83
+0.76
12.52%
Ranking of countries by current statistics by years


Comments: