29
/
en
AIzaSyAYiBZKx7MnpbEhh9jyipgxe19OcubqV5w
April 1, 2024
121865
Dominican Republic
DOM
true
2
1
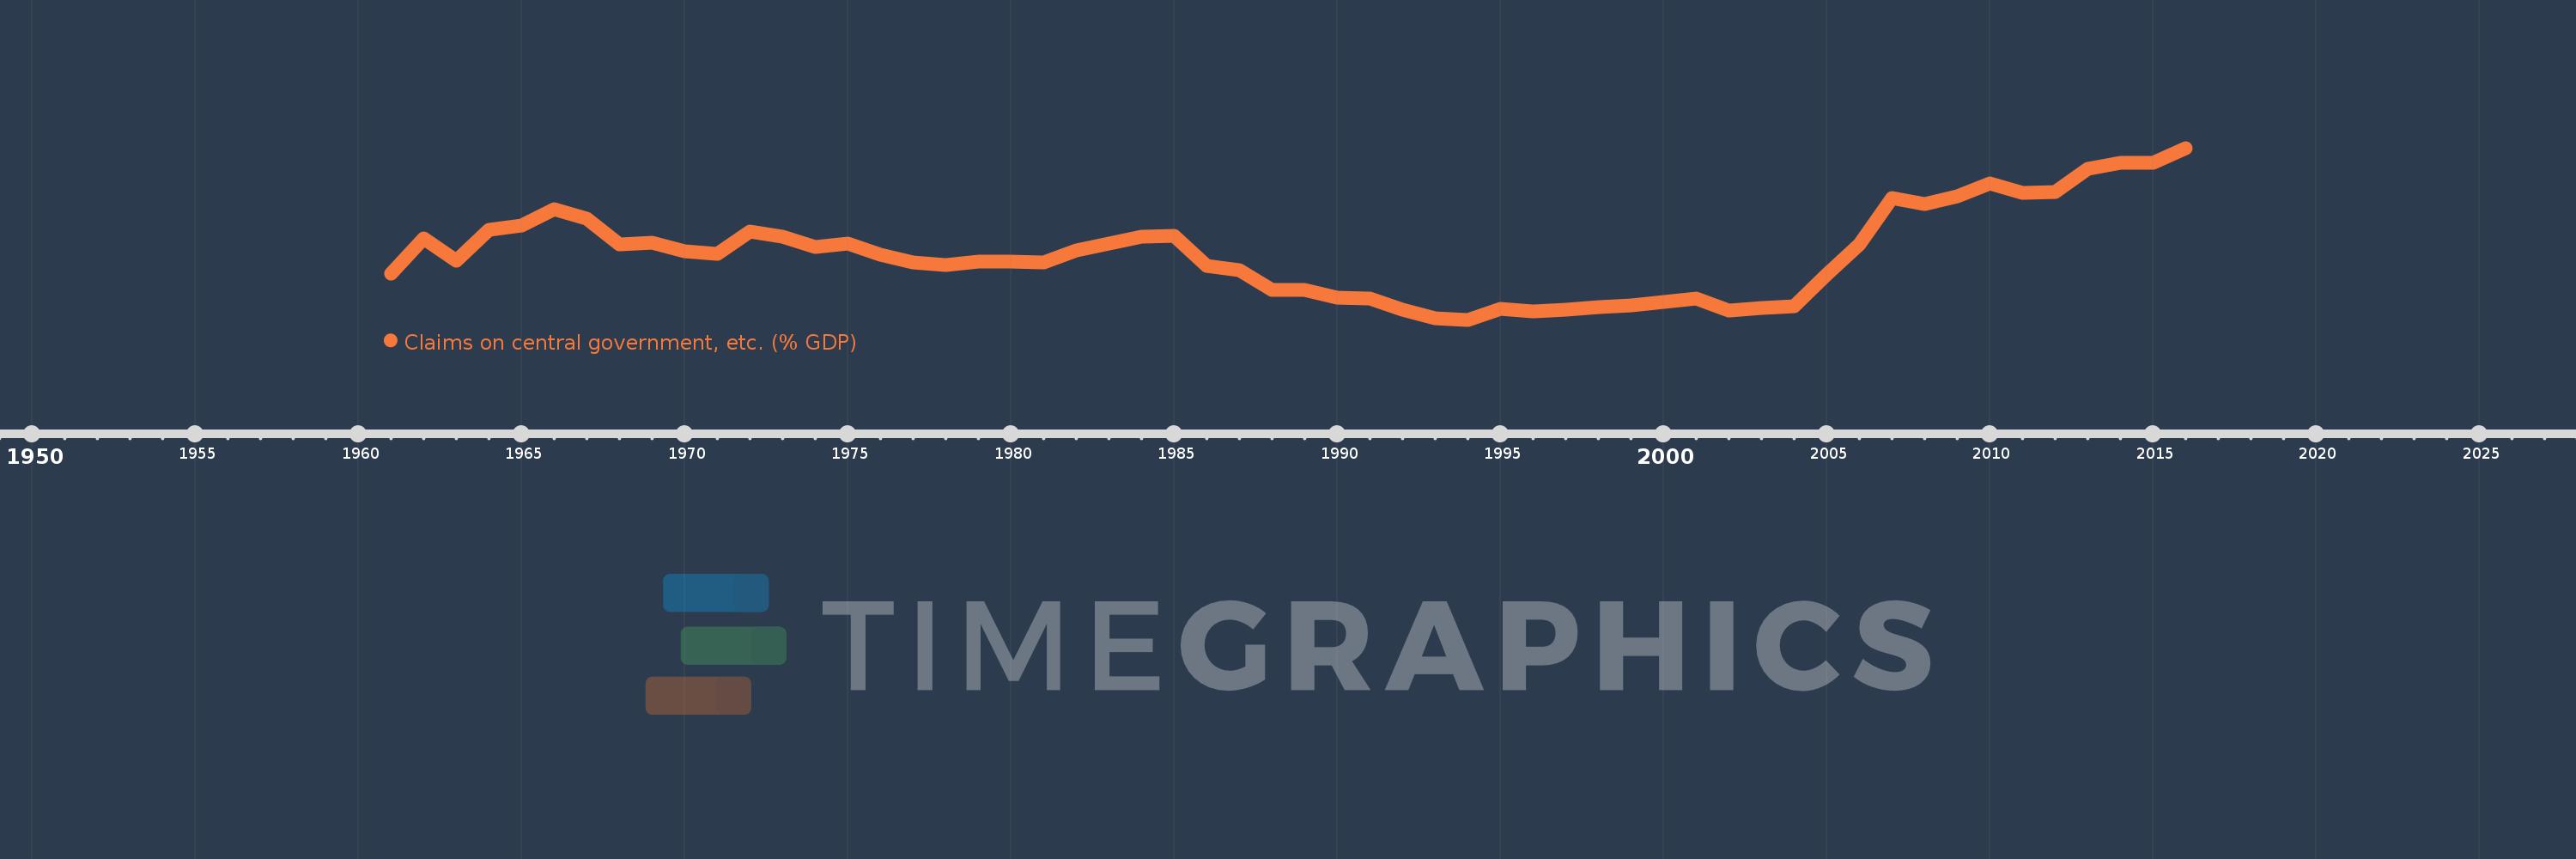
Claims on central government, etc. (% GDP)
2016,2015,2014,2013,2012,2011,2010,2009,2008,2007,2006,2005,2004,2003,2002,2001,2000,1999,1998,1997,1996,1995,1994,1993,1992,1991,1990,1989,1988,1987,1986,1985,1984,1983,1982,1981,1980,1979,1978,1977,1976,1975,1974,1973,1972,1971,1970,1969,1968,1967,1966,1965,1964,1963,1962,1961
This statistics in other country:
AfghanistanAlbaniaAlgeriaAngolaAntigua and BarbudaArab WorldArgentinaArmeniaArubaAustraliaAustriaAzerbaijanBahamas, TheBahrainBangladeshBarbadosBelarusBelgiumBelizeBeninBhutanBoliviaBosnia and HerzegovinaBotswanaBrazilBrunei DarussalamBulgariaBurkina FasoBurundiCabo VerdeCambodiaCameroonCanadaCaribbean small statesCentral African RepublicCentral Europe and the BalticsChadChileChinaColombiaComorosCongo, Dem. Rep.Congo, Rep.Costa RicaCote d'IvoireCroatiaCyprusCzech RepublicDenmarkDjiboutiDominicaDominican RepublicEarly-demographic dividendEast Asia & PacificEast Asia & Pacific (excluding high income)East Asia & Pacific (IDA & IBRD countries)EcuadorEgypt, Arab Rep.El SalvadorEquatorial GuineaEritreaEstoniaEthiopiaEuro areaEurope & Central AsiaEurope & Central Asia (excluding high income)Europe & Central Asia (IDA & IBRD countries)European UnionFijiFinlandFragile and conflict affected situationsFranceGabonGambia, TheGeorgiaGermanyGhanaGreeceGrenadaGuatemalaGuineaGuinea-BissauGuyanaHaitiHeavily indebted poor countries (HIPC)High incomeHondurasHong Kong SAR, ChinaHungaryIBRD onlyIcelandIDA & IBRD totalIDA blendIDA onlyIDA totalIndiaIndonesiaIran, Islamic Rep.IraqIrelandIsraelItalyJamaicaJapanJordanKazakhstanKenyaKorea, Rep.KosovoKuwaitKyrgyz RepublicLao PDRLate-demographic dividendLatin America & Caribbean Latin America & Caribbean (excluding high income)Latin America & the Caribbean (IDA & IBRD countries)LatviaLeast developed countries: UN classificationLebanonLesothoLiberiaLibyaLithuaniaLow & middle incomeLow incomeLower middle incomeLuxembourgMacao SAR, ChinaMacedonia, FYRMadagascarMalawiMalaysiaMaldivesMaliMaltaMauritaniaMauritiusMexicoMicronesia, Fed. Sts.Middle East & North AfricaMiddle East & North Africa (excluding high income)Middle East & North Africa (IDA & IBRD countries)Middle incomeMoldovaMongoliaMontenegroMoroccoMozambiqueMyanmarNamibiaNepalNetherlandsNew ZealandNicaraguaNigerNigeriaNorth AmericaNorwayOECD membersOmanOther small statesPacific island small statesPakistanPanamaPapua New GuineaParaguayPeruPhilippinesPolandPortugalPost-demographic dividendPre-demographic dividendQatarRomaniaRussian FederationRwandaSamoaSao Tome and PrincipeSaudi ArabiaSenegalSerbiaSeychellesSierra LeoneSingaporeSlovak RepublicSloveniaSmall statesSolomon IslandsSouth AfricaSouth AsiaSouth Asia (IDA & IBRD)South SudanSpainSri LankaSt. Kitts and NevisSt. LuciaSt. Vincent and the GrenadinesSub-Saharan Africa Sub-Saharan Africa (excluding high income)Sub-Saharan Africa (IDA & IBRD countries)SudanSurinameSwazilandSwedenSwitzerlandSyrian Arab RepublicTajikistanTanzaniaThailandTimor-LesteTogoTongaTrinidad and TobagoTunisiaTurkeyUgandaUkraineUnited Arab EmiratesUnited KingdomUnited StatesUpper middle incomeUruguayVanuatuVenezuela, RBVietnamWest Bank and GazaWorldYemen, Rep.ZambiaZimbabwe Timeline:
This timeline shows a graph from 1961 to 2016 of Dominican Republic. No data until 1960. Number of actual observations by date: 56.
Source name:
World Development Indicators
Source organization:
International Monetary Fund, International Financial Statistics and data files, and World Bank and OECD GDP estimates.
Categories, topics:
Financial Sector
Last updated:
apr 23, 2017
Indicators value changes by year
Minimum:
-1.827
jan 1, 1994
Maximum:
25.609
jan 1, 2016
At the date of observation
Value
Absolute change
Change from previous value
jan 1, 1961
5.562
+5.562
0.0%
jan 1, 1962
11.222
+5.659
101.75%
jan 1, 1963
7.56
-3.662
-32.63%
jan 1, 1964
12.489
+4.93
65.21%
jan 1, 1965
13.29
+0.8
6.41%
jan 1, 1966
15.82
+2.531
19.04%
jan 1, 1967
14.351
-1.469
-9.29%
jan 1, 1968
10.151
-4.2
-29.27%
jan 1, 1969
10.526
+0.376
3.7%
jan 1, 1970
9.063
-1.463
-13.9%
jan 1, 1971
8.694
-0.369
-4.07%
jan 1, 1972
12.298
+3.604
41.46%
jan 1, 1973
11.413
-0.885
-7.2%
jan 1, 1974
9.803
-1.61
-14.1%
jan 1, 1975
10.34
+0.537
5.48%
jan 1, 1976
8.605
-1.735
-16.78%
jan 1, 1977
7.299
-1.306
-15.18%
jan 1, 1978
6.912
-0.387
-5.31%
jan 1, 1979
7.449
+0.537
7.77%
jan 1, 1980
7.516
+0.067
0.9%
jan 1, 1981
7.299
-0.217
-2.88%
jan 1, 1982
9.274
+1.975
27.05%
jan 1, 1983
10.409
+1.135
12.24%
jan 1, 1984
11.382
+0.973
9.35%
jan 1, 1985
11.516
+0.135
1.18%
jan 1, 1986
6.718
-4.798
-41.66%
jan 1, 1987
6.075
-0.644
-9.58%
jan 1, 1988
2.882
-3.193
-52.56%
jan 1, 1989
2.984
+0.102
3.55%
jan 1, 1990
1.672
-1.312
-43.97%
jan 1, 1991
1.604
-0.068
-4.1%
jan 1, 1992
-0.224
-1.828
-113.98%
jan 1, 1993
-1.658
-1.433
639.38%
jan 1, 1994
-1.827
-0.17
10.24%
jan 1, 1995
-0.151
+1.676
-91.74%
jan 1, 1996
-0.47
-0.319
211.53%
jan 1, 1997
-0.279
+0.191
-40.68%
jan 1, 1998
0.181
+0.46
-164.74%
jan 1, 1999
0.496
+0.315
174.48%
jan 1, 2000
1.011
+0.515
103.89%
jan 1, 2001
1.598
+0.587
58.11%
jan 1, 2002
-0.362
-1.96
-122.63%
jan 1, 2003
0.076
+0.438
-121.03%
jan 1, 2004
0.376
+0.3
394.7%
jan 1, 2005
5.373
+4.997
1.33K%
jan 1, 2006
10.259
+4.887
90.95%
jan 1, 2007
17.662
+7.402
72.15%
jan 1, 2008
16.613
-1.048
-5.94%
jan 1, 2009
17.926
+1.313
7.9%
jan 1, 2010
19.956
+2.029
11.32%
jan 1, 2011
18.473
-1.482
-7.43%
jan 1, 2012
18.614
+0.141
0.76%
jan 1, 2013
22.335
+3.721
19.99%
jan 1, 2014
23.227
+0.892
3.99%
jan 1, 2015
23.256
+0.029
0.12%
jan 1, 2016
25.609
+2.353
10.12%
Ranking of countries by current statistics by years


Comments: