29
/
en
AIzaSyAYiBZKx7MnpbEhh9jyipgxe19OcubqV5w
April 1, 2024
59586
Sub-Saharan Africa (excluding high income)
SSA
false
2
1
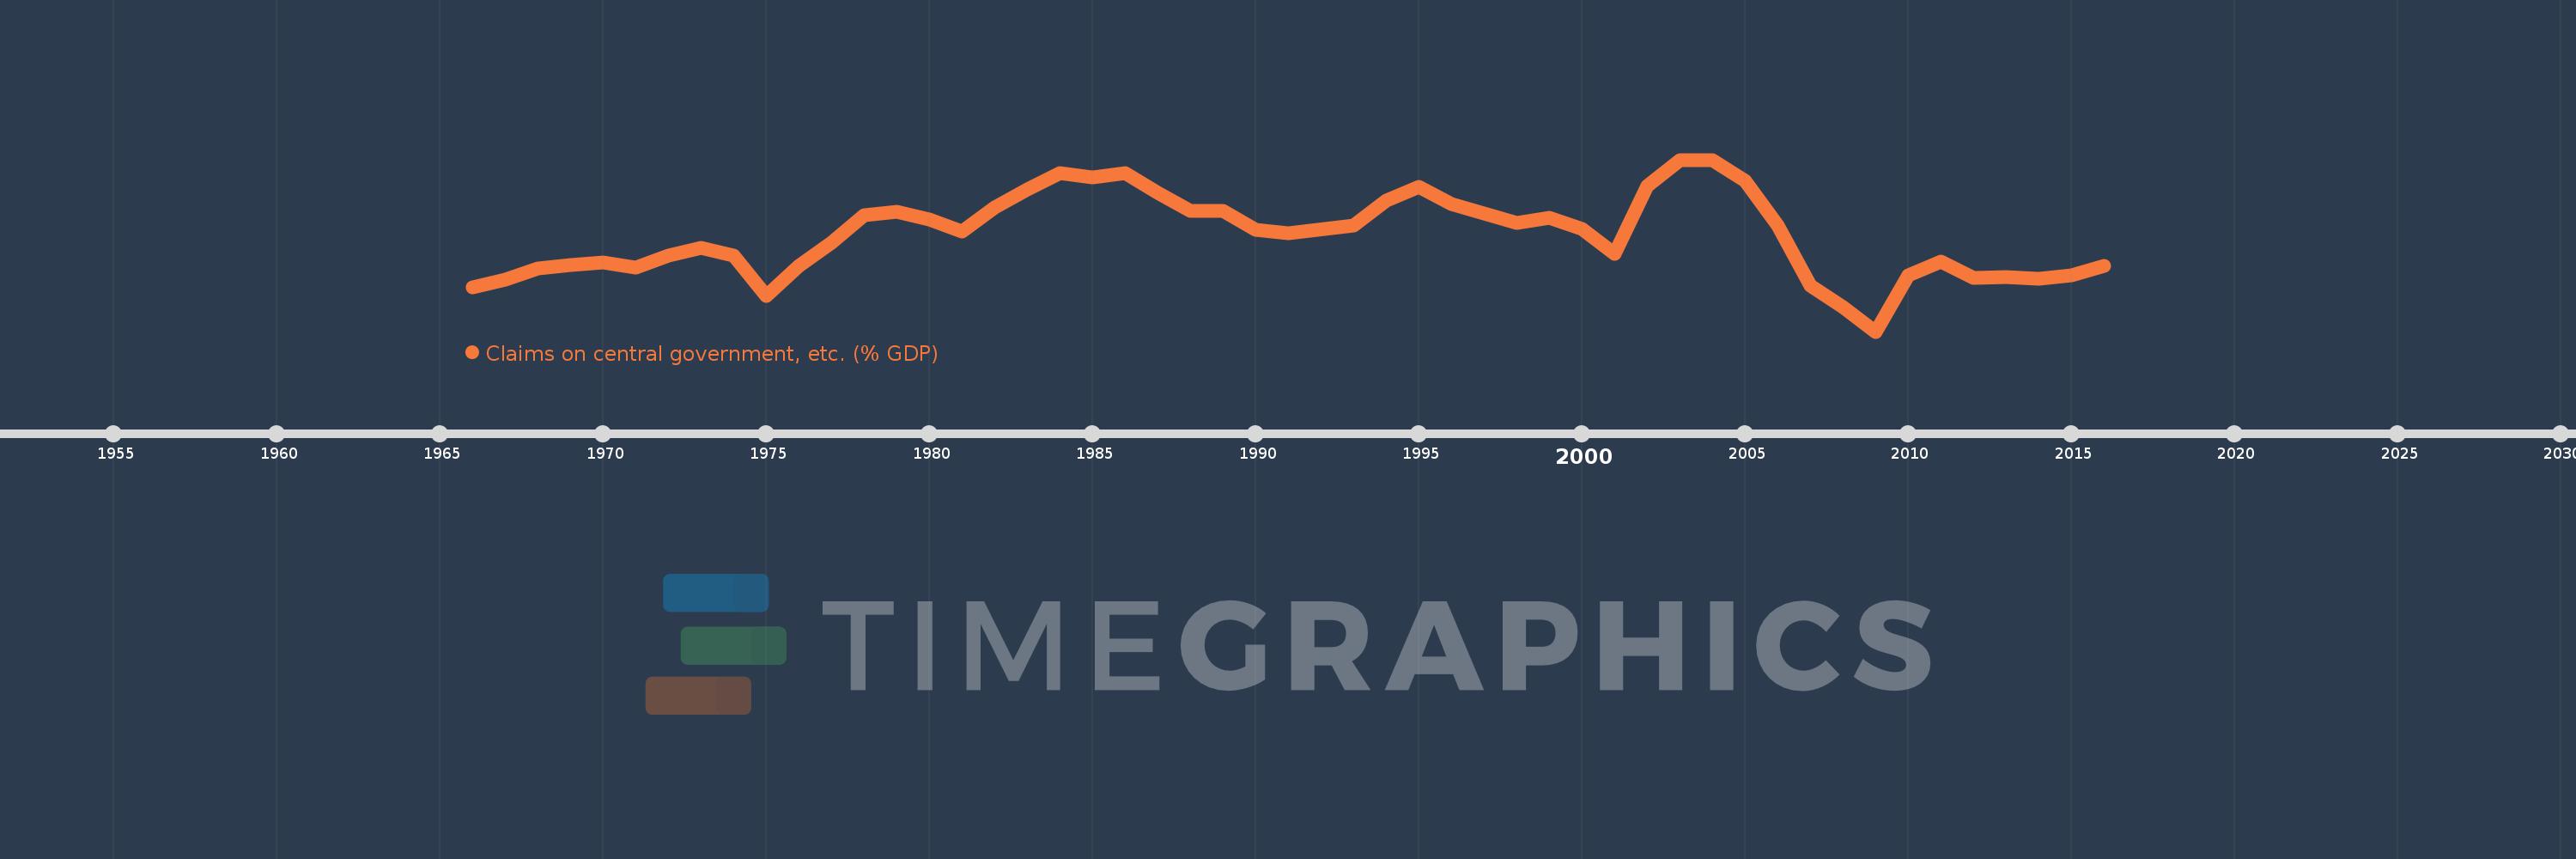
Claims on central government, etc. (% GDP)
2016,2015,2014,2013,2012,2011,2010,2009,2008,2007,2006,2005,2004,2003,2002,2001,2000,1999,1998,1997,1996,1995,1994,1993,1991,1990,1989,1988,1987,1986,1985,1984,1983,1982,1981,1980,1979,1978,1977,1976,1975,1974,1973,1972,1971,1970,1969,1968,1967,1966
This statistics in other country:
AfghanistanAlbaniaAlgeriaAngolaAntigua and BarbudaArab WorldArgentinaArmeniaArubaAustraliaAustriaAzerbaijanBahamas, TheBahrainBangladeshBarbadosBelarusBelgiumBelizeBeninBhutanBoliviaBosnia and HerzegovinaBotswanaBrazilBrunei DarussalamBulgariaBurkina FasoBurundiCabo VerdeCambodiaCameroonCanadaCaribbean small statesCentral African RepublicCentral Europe and the BalticsChadChileChinaColombiaComorosCongo, Dem. Rep.Congo, Rep.Costa RicaCote d'IvoireCroatiaCyprusCzech RepublicDenmarkDjiboutiDominicaDominican RepublicEarly-demographic dividendEast Asia & PacificEast Asia & Pacific (excluding high income)East Asia & Pacific (IDA & IBRD countries)EcuadorEgypt, Arab Rep.El SalvadorEquatorial GuineaEritreaEstoniaEthiopiaEuro areaEurope & Central AsiaEurope & Central Asia (excluding high income)Europe & Central Asia (IDA & IBRD countries)European UnionFijiFinlandFragile and conflict affected situationsFranceGabonGambia, TheGeorgiaGermanyGhanaGreeceGrenadaGuatemalaGuineaGuinea-BissauGuyanaHaitiHeavily indebted poor countries (HIPC)High incomeHondurasHong Kong SAR, ChinaHungaryIBRD onlyIcelandIDA & IBRD totalIDA blendIDA onlyIDA totalIndiaIndonesiaIran, Islamic Rep.IraqIrelandIsraelItalyJamaicaJapanJordanKazakhstanKenyaKorea, Rep.KosovoKuwaitKyrgyz RepublicLao PDRLate-demographic dividendLatin America & Caribbean Latin America & Caribbean (excluding high income)Latin America & the Caribbean (IDA & IBRD countries)LatviaLeast developed countries: UN classificationLebanonLesothoLiberiaLibyaLithuaniaLow & middle incomeLow incomeLower middle incomeLuxembourgMacao SAR, ChinaMacedonia, FYRMadagascarMalawiMalaysiaMaldivesMaliMaltaMauritaniaMauritiusMexicoMicronesia, Fed. Sts.Middle East & North AfricaMiddle East & North Africa (excluding high income)Middle East & North Africa (IDA & IBRD countries)Middle incomeMoldovaMongoliaMontenegroMoroccoMozambiqueMyanmarNamibiaNepalNetherlandsNew ZealandNicaraguaNigerNigeriaNorth AmericaNorwayOECD membersOmanOther small statesPacific island small statesPakistanPanamaPapua New GuineaParaguayPeruPhilippinesPolandPortugalPost-demographic dividendPre-demographic dividendQatarRomaniaRussian FederationRwandaSamoaSao Tome and PrincipeSaudi ArabiaSenegalSerbiaSeychellesSierra LeoneSingaporeSlovak RepublicSloveniaSmall statesSolomon IslandsSouth AfricaSouth AsiaSouth Asia (IDA & IBRD)South SudanSpainSri LankaSt. Kitts and NevisSt. LuciaSt. Vincent and the GrenadinesSub-Saharan Africa Sub-Saharan Africa (excluding high income)Sub-Saharan Africa (IDA & IBRD countries)SudanSurinameSwazilandSwedenSwitzerlandSyrian Arab RepublicTajikistanTanzaniaThailandTimor-LesteTogoTongaTrinidad and TobagoTunisiaTurkeyUgandaUkraineUnited Arab EmiratesUnited KingdomUnited StatesUpper middle incomeUruguayVanuatuVenezuela, RBVietnamWest Bank and GazaWorldYemen, Rep.ZambiaZimbabwe Timeline:
This timeline shows a graph from 1966 to 2016 of Sub-Saharan Africa (excluding high income). No data until 1965. Number of actual observations by date: 50.
Source name:
World Development Indicators
Source organization:
International Monetary Fund, International Financial Statistics and data files, and World Bank and OECD GDP estimates.
Categories, topics:
Financial Sector
Last updated:
apr 23, 2017
Indicators value changes by year
Maximum:
15.651
jan 1, 2004
At the date of observation
Value
Absolute change
Change from previous value
jan 1, 1966
5.057
+5.057
0.0%
jan 1, 1967
5.718
+0.661
13.08%
jan 1, 1968
6.668
+0.95
16.61%
jan 1, 1969
6.966
+0.298
4.47%
jan 1, 1970
7.113
+0.147
2.11%
jan 1, 1971
6.702
-0.411
-5.78%
jan 1, 1972
7.726
+1.023
15.27%
jan 1, 1973
8.326
+0.601
7.78%
jan 1, 1974
7.692
-0.635
-7.63%
jan 1, 1975
4.354
-3.338
-43.39%
jan 1, 1976
6.866
+2.512
57.69%
jan 1, 1977
8.787
+1.921
27.98%
jan 1, 1978
11.068
+2.281
25.96%
jan 1, 1979
11.322
+0.254
2.3%
jan 1, 1980
10.732
-0.59
-5.21%
jan 1, 1981
9.723
-1.008
-9.39%
jan 1, 1982
11.704
+1.98
20.37%
jan 1, 1983
13.208
+1.504
12.85%
jan 1, 1984
14.554
+1.346
10.19%
jan 1, 1985
14.217
-0.337
-2.32%
jan 1, 1986
14.52
+0.303
2.13%
jan 1, 1987
12.898
-1.622
-11.17%
jan 1, 1988
11.406
-1.492
-11.57%
jan 1, 1989
11.418
+0.012
0.11%
jan 1, 1990
9.852
-1.567
-13.72%
jan 1, 1991
9.585
-0.266
-2.7%
jan 1, 1993
10.214
+0.629
6.56%
jan 1, 1994
12.242
+2.028
19.85%
jan 1, 1995
13.435
+1.193
9.75%
jan 1, 1996
11.961
-1.474
-10.97%
jan 1, 1997
11.205
-0.757
-6.33%
jan 1, 1998
10.447
-0.758
-6.76%
jan 1, 1999
10.868
+0.421
4.03%
jan 1, 2000
9.948
-0.921
-8.47%
jan 1, 2001
7.842
-2.106
-21.17%
jan 1, 2002
13.51
+5.669
72.29%
jan 1, 2003
15.592
+2.081
15.4%
jan 1, 2004
15.651
+0.059
0.38%
jan 1, 2005
13.938
-1.713
-10.94%
jan 1, 2006
10.217
-3.721
-26.7%
jan 1, 2007
5.198
-5.019
-49.12%
jan 1, 2008
3.446
-1.752
-33.7%
jan 1, 2009
1.416
-2.03
-58.9%
jan 1, 2010
6.109
+4.693
331.33%
jan 1, 2011
7.183
+1.074
17.58%
jan 1, 2012
5.86
-1.323
-18.42%
jan 1, 2013
5.94
+0.08
1.36%
jan 1, 2014
5.786
-0.154
-2.59%
jan 1, 2015
6.069
+0.282
4.88%
jan 1, 2016
6.83
+0.761
12.54%
Ranking of countries by current statistics by years


Comments: