29
/
en
AIzaSyAYiBZKx7MnpbEhh9jyipgxe19OcubqV5w
April 1, 2024
52456
OECD members
OED
false
2
1
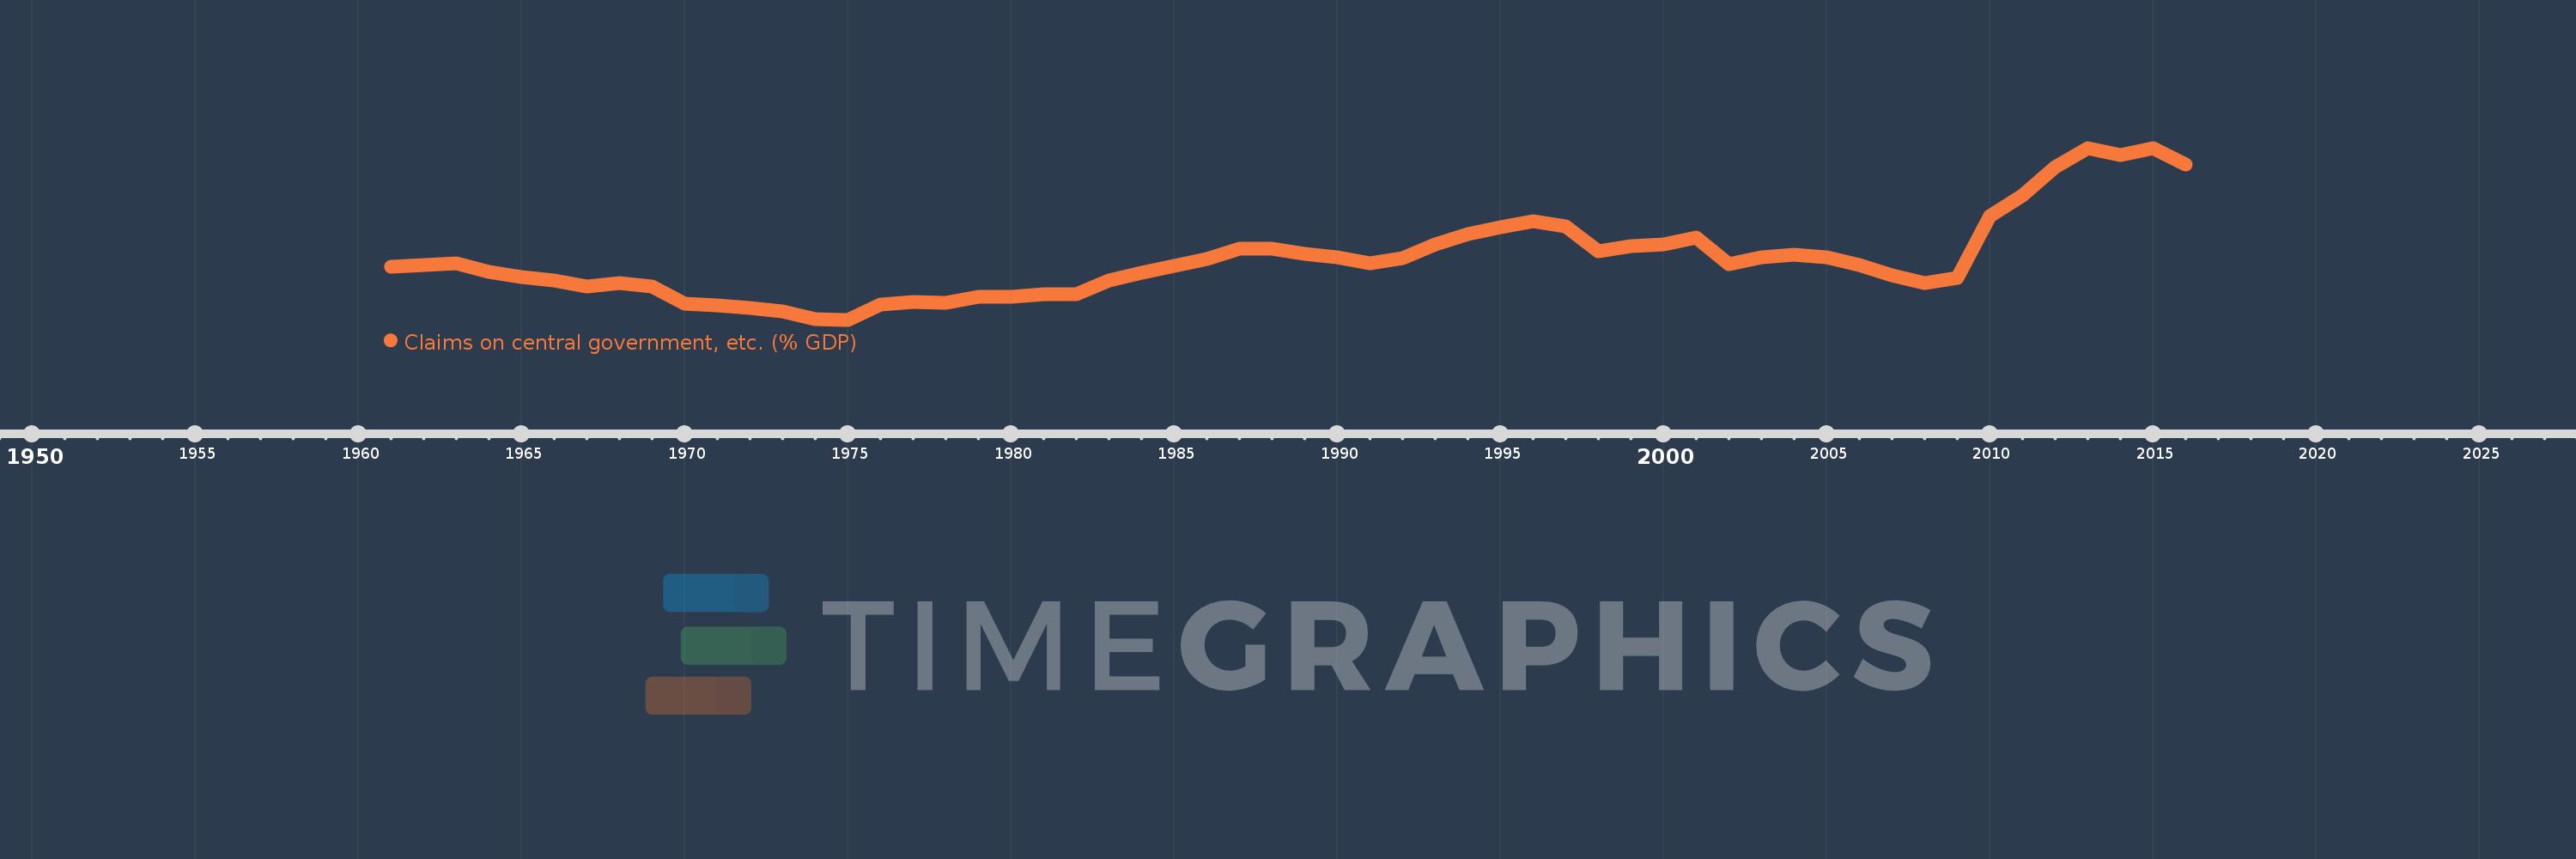
Claims on central government, etc. (% GDP)
2016,2015,2014,2013,2012,2011,2010,2009,2008,2007,2006,2005,2004,2003,2002,2001,2000,1999,1998,1997,1996,1995,1994,1993,1992,1991,1990,1989,1988,1987,1986,1985,1984,1983,1982,1981,1980,1979,1978,1977,1976,1975,1974,1973,1972,1971,1970,1969,1968,1967,1966,1965,1964,1963,1962,1961
This statistics in other country:
AfghanistanAlbaniaAlgeriaAngolaAntigua and BarbudaArab WorldArgentinaArmeniaArubaAustraliaAustriaAzerbaijanBahamas, TheBahrainBangladeshBarbadosBelarusBelgiumBelizeBeninBhutanBoliviaBosnia and HerzegovinaBotswanaBrazilBrunei DarussalamBulgariaBurkina FasoBurundiCabo VerdeCambodiaCameroonCanadaCaribbean small statesCentral African RepublicCentral Europe and the BalticsChadChileChinaColombiaComorosCongo, Dem. Rep.Congo, Rep.Costa RicaCote d'IvoireCroatiaCyprusCzech RepublicDenmarkDjiboutiDominicaDominican RepublicEarly-demographic dividendEast Asia & PacificEast Asia & Pacific (excluding high income)East Asia & Pacific (IDA & IBRD countries)EcuadorEgypt, Arab Rep.El SalvadorEquatorial GuineaEritreaEstoniaEthiopiaEuro areaEurope & Central AsiaEurope & Central Asia (excluding high income)Europe & Central Asia (IDA & IBRD countries)European UnionFijiFinlandFragile and conflict affected situationsFranceGabonGambia, TheGeorgiaGermanyGhanaGreeceGrenadaGuatemalaGuineaGuinea-BissauGuyanaHaitiHeavily indebted poor countries (HIPC)High incomeHondurasHong Kong SAR, ChinaHungaryIBRD onlyIcelandIDA & IBRD totalIDA blendIDA onlyIDA totalIndiaIndonesiaIran, Islamic Rep.IraqIrelandIsraelItalyJamaicaJapanJordanKazakhstanKenyaKorea, Rep.KosovoKuwaitKyrgyz RepublicLao PDRLate-demographic dividendLatin America & Caribbean Latin America & Caribbean (excluding high income)Latin America & the Caribbean (IDA & IBRD countries)LatviaLeast developed countries: UN classificationLebanonLesothoLiberiaLibyaLithuaniaLow & middle incomeLow incomeLower middle incomeLuxembourgMacao SAR, ChinaMacedonia, FYRMadagascarMalawiMalaysiaMaldivesMaliMaltaMauritaniaMauritiusMexicoMicronesia, Fed. Sts.Middle East & North AfricaMiddle East & North Africa (excluding high income)Middle East & North Africa (IDA & IBRD countries)Middle incomeMoldovaMongoliaMontenegroMoroccoMozambiqueMyanmarNamibiaNepalNetherlandsNew ZealandNicaraguaNigerNigeriaNorth AmericaNorwayOECD membersOmanOther small statesPacific island small statesPakistanPanamaPapua New GuineaParaguayPeruPhilippinesPolandPortugalPost-demographic dividendPre-demographic dividendQatarRomaniaRussian FederationRwandaSamoaSao Tome and PrincipeSaudi ArabiaSenegalSerbiaSeychellesSierra LeoneSingaporeSlovak RepublicSloveniaSmall statesSolomon IslandsSouth AfricaSouth AsiaSouth Asia (IDA & IBRD)South SudanSpainSri LankaSt. Kitts and NevisSt. LuciaSt. Vincent and the GrenadinesSub-Saharan Africa Sub-Saharan Africa (excluding high income)Sub-Saharan Africa (IDA & IBRD countries)SudanSurinameSwazilandSwedenSwitzerlandSyrian Arab RepublicTajikistanTanzaniaThailandTimor-LesteTogoTongaTrinidad and TobagoTunisiaTurkeyUgandaUkraineUnited Arab EmiratesUnited KingdomUnited StatesUpper middle incomeUruguayVanuatuVenezuela, RBVietnamWest Bank and GazaWorldYemen, Rep.ZambiaZimbabwe Timeline:
This timeline shows a graph from 1961 to 2016 of OECD members. No data until 1960. Number of actual observations by date: 56.
Source name:
World Development Indicators
Source organization:
International Monetary Fund, International Financial Statistics and data files, and World Bank and OECD GDP estimates.
Categories, topics:
Financial Sector
Last updated:
apr 23, 2017
Indicators value changes by year
Minimum:
11.767
jan 1, 1975
Maximum:
37.676
jan 1, 2013
At the date of observation
Value
Absolute change
Change from previous value
jan 1, 1961
19.812
+19.812
0.0%
jan 1, 1962
20.013
+0.201
1.01%
jan 1, 1963
20.282
+0.269
1.34%
jan 1, 1964
18.968
-1.314
-6.48%
jan 1, 1965
18.251
-0.718
-3.78%
jan 1, 1966
17.623
-0.628
-3.44%
jan 1, 1967
16.762
-0.861
-4.88%
jan 1, 1968
17.323
+0.561
3.35%
jan 1, 1969
16.747
-0.576
-3.32%
jan 1, 1970
14.232
-2.515
-15.02%
jan 1, 1971
13.978
-0.254
-1.78%
jan 1, 1972
13.482
-0.496
-3.55%
jan 1, 1973
13.054
-0.428
-3.17%
jan 1, 1974
11.856
-1.199
-9.18%
jan 1, 1975
11.767
-0.089
-0.75%
jan 1, 1976
14.102
+2.335
19.84%
jan 1, 1977
14.432
+0.331
2.35%
jan 1, 1978
14.382
-0.05
-0.35%
jan 1, 1979
15.275
+0.893
6.21%
jan 1, 1980
15.195
-0.08
-0.52%
jan 1, 1981
15.611
+0.416
2.74%
jan 1, 1982
15.63
+0.019
0.12%
jan 1, 1983
17.712
+2.081
13.32%
jan 1, 1984
18.915
+1.204
6.8%
jan 1, 1985
19.884
+0.969
5.12%
jan 1, 1986
20.873
+0.989
4.97%
jan 1, 1987
22.497
+1.624
7.78%
jan 1, 1988
22.424
-0.073
-0.33%
jan 1, 1989
21.727
-0.697
-3.11%
jan 1, 1990
21.232
-0.495
-2.28%
jan 1, 1991
20.241
-0.991
-4.67%
jan 1, 1992
21.104
+0.863
4.26%
jan 1, 1993
23.131
+2.027
9.6%
jan 1, 1994
24.714
+1.583
6.84%
jan 1, 1995
25.664
+0.95
3.84%
jan 1, 1996
26.688
+1.024
3.99%
jan 1, 1997
25.802
-0.886
-3.32%
jan 1, 1998
22.126
-3.677
-14.25%
jan 1, 1999
22.853
+0.728
3.29%
jan 1, 2000
23.084
+0.231
1.01%
jan 1, 2001
24.167
+1.083
4.69%
jan 1, 2002
20.164
-4.003
-16.56%
jan 1, 2003
21.165
+1.0
4.96%
jan 1, 2004
21.577
+0.412
1.95%
jan 1, 2005
21.149
-0.428
-1.98%
jan 1, 2006
20.026
-1.123
-5.31%
jan 1, 2007
18.42
-1.606
-8.02%
jan 1, 2008
17.321
-1.099
-5.97%
jan 1, 2009
18.066
+0.744
4.3%
jan 1, 2010
27.435
+9.369
51.86%
jan 1, 2011
30.555
+3.12
11.37%
jan 1, 2012
34.746
+4.191
13.71%
jan 1, 2013
37.676
+2.93
8.43%
jan 1, 2014
36.588
-1.088
-2.89%
jan 1, 2015
37.583
+0.994
2.72%
jan 1, 2016
35.125
-2.457
-6.54%
Ranking of countries by current statistics by years


Comments: