29
/
en
AIzaSyAYiBZKx7MnpbEhh9jyipgxe19OcubqV5w
April 1, 2024
214102
Norway
NOR
true
2
1
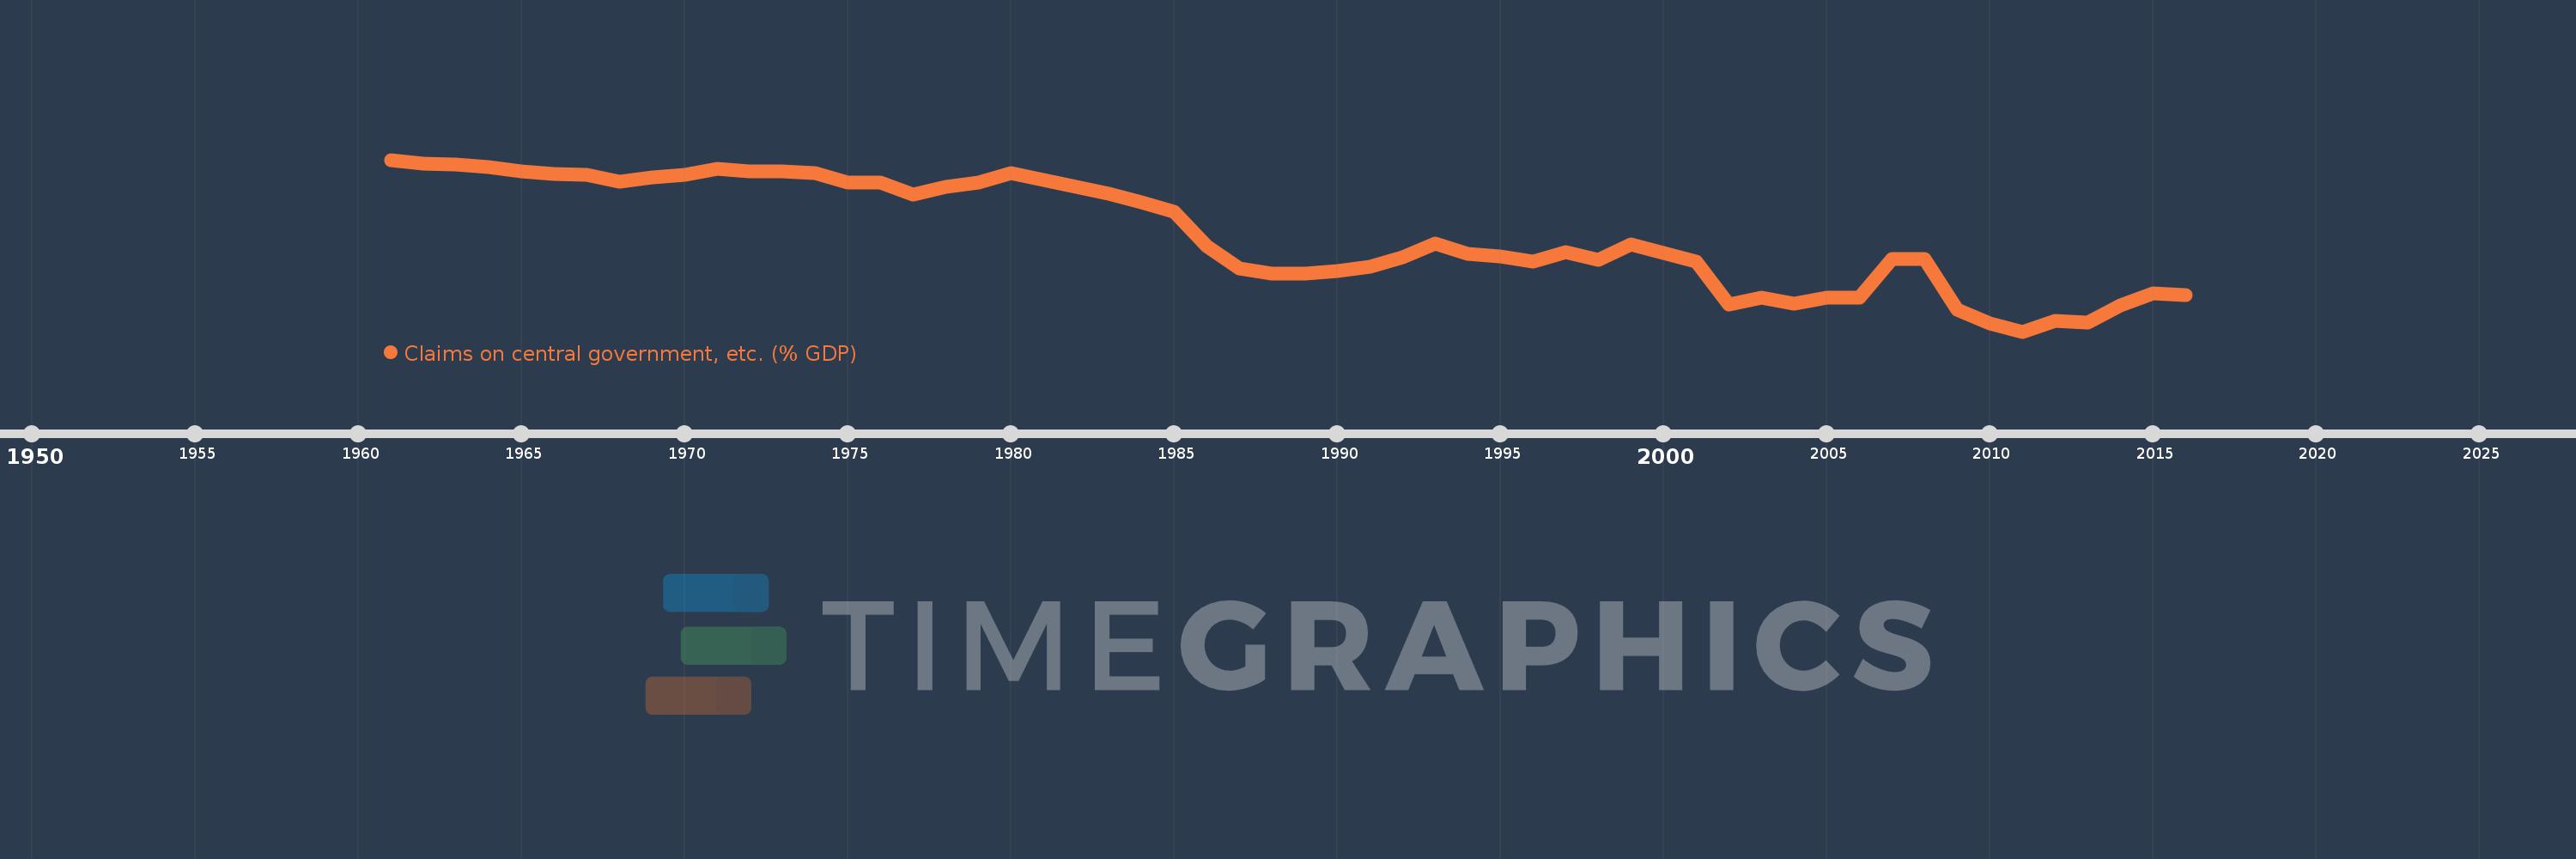
Claims on central government, etc. (% GDP)
2016,2015,2014,2013,2012,2011,2010,2009,2008,2007,2006,2005,2004,2003,2002,2001,2000,1999,1998,1997,1996,1995,1994,1993,1992,1991,1990,1989,1988,1987,1986,1985,1984,1983,1982,1981,1980,1979,1978,1977,1976,1975,1974,1973,1972,1971,1970,1969,1968,1967,1966,1965,1964,1963,1962,1961
This statistics in other country:
AfghanistanAlbaniaAlgeriaAngolaAntigua and BarbudaArab WorldArgentinaArmeniaArubaAustraliaAustriaAzerbaijanBahamas, TheBahrainBangladeshBarbadosBelarusBelgiumBelizeBeninBhutanBoliviaBosnia and HerzegovinaBotswanaBrazilBrunei DarussalamBulgariaBurkina FasoBurundiCabo VerdeCambodiaCameroonCanadaCaribbean small statesCentral African RepublicCentral Europe and the BalticsChadChileChinaColombiaComorosCongo, Dem. Rep.Congo, Rep.Costa RicaCote d'IvoireCroatiaCyprusCzech RepublicDenmarkDjiboutiDominicaDominican RepublicEarly-demographic dividendEast Asia & PacificEast Asia & Pacific (excluding high income)East Asia & Pacific (IDA & IBRD countries)EcuadorEgypt, Arab Rep.El SalvadorEquatorial GuineaEritreaEstoniaEthiopiaEuro areaEurope & Central AsiaEurope & Central Asia (excluding high income)Europe & Central Asia (IDA & IBRD countries)European UnionFijiFinlandFragile and conflict affected situationsFranceGabonGambia, TheGeorgiaGermanyGhanaGreeceGrenadaGuatemalaGuineaGuinea-BissauGuyanaHaitiHeavily indebted poor countries (HIPC)High incomeHondurasHong Kong SAR, ChinaHungaryIBRD onlyIcelandIDA & IBRD totalIDA blendIDA onlyIDA totalIndiaIndonesiaIran, Islamic Rep.IraqIrelandIsraelItalyJamaicaJapanJordanKazakhstanKenyaKorea, Rep.KosovoKuwaitKyrgyz RepublicLao PDRLate-demographic dividendLatin America & Caribbean Latin America & Caribbean (excluding high income)Latin America & the Caribbean (IDA & IBRD countries)LatviaLeast developed countries: UN classificationLebanonLesothoLiberiaLibyaLithuaniaLow & middle incomeLow incomeLower middle incomeLuxembourgMacao SAR, ChinaMacedonia, FYRMadagascarMalawiMalaysiaMaldivesMaliMaltaMauritaniaMauritiusMexicoMicronesia, Fed. Sts.Middle East & North AfricaMiddle East & North Africa (excluding high income)Middle East & North Africa (IDA & IBRD countries)Middle incomeMoldovaMongoliaMontenegroMoroccoMozambiqueMyanmarNamibiaNepalNetherlandsNew ZealandNicaraguaNigerNigeriaNorth AmericaNorwayOECD membersOmanOther small statesPacific island small statesPakistanPanamaPapua New GuineaParaguayPeruPhilippinesPolandPortugalPost-demographic dividendPre-demographic dividendQatarRomaniaRussian FederationRwandaSamoaSao Tome and PrincipeSaudi ArabiaSenegalSerbiaSeychellesSierra LeoneSingaporeSlovak RepublicSloveniaSmall statesSolomon IslandsSouth AfricaSouth AsiaSouth Asia (IDA & IBRD)South SudanSpainSri LankaSt. Kitts and NevisSt. LuciaSt. Vincent and the GrenadinesSub-Saharan Africa Sub-Saharan Africa (excluding high income)Sub-Saharan Africa (IDA & IBRD countries)SudanSurinameSwazilandSwedenSwitzerlandSyrian Arab RepublicTajikistanTanzaniaThailandTimor-LesteTogoTongaTrinidad and TobagoTunisiaTurkeyUgandaUkraineUnited Arab EmiratesUnited KingdomUnited StatesUpper middle incomeUruguayVanuatuVenezuela, RBVietnamWest Bank and GazaWorldYemen, Rep.ZambiaZimbabwe Timeline:
This timeline shows a graph from 1961 to 2016 of Norway. No data until 1960. Number of actual observations by date: 56.
Source name:
World Development Indicators
Source organization:
International Monetary Fund, International Financial Statistics and data files, and World Bank and OECD GDP estimates.
Categories, topics:
Financial Sector
Last updated:
apr 23, 2017
Indicators value changes by year
Minimum:
-17.982
jan 1, 2011
Maximum:
14.907
jan 1, 1961
At the date of observation
Value
Absolute change
Change from previous value
jan 1, 1961
14.907
+14.907
0.0%
jan 1, 1962
14.226
-0.682
-4.57%
jan 1, 1963
14.066
-0.159
-1.12%
jan 1, 1964
13.572
-0.494
-3.51%
jan 1, 1965
12.725
-0.847
-6.24%
jan 1, 1966
12.143
-0.582
-4.57%
jan 1, 1967
12.074
-0.07
-0.57%
jan 1, 1968
10.638
-1.435
-11.89%
jan 1, 1969
11.589
+0.95
8.93%
jan 1, 1970
12.047
+0.459
3.96%
jan 1, 1971
13.143
+1.096
9.1%
jan 1, 1972
12.751
-0.393
-2.99%
jan 1, 1973
12.705
-0.045
-0.36%
jan 1, 1974
12.315
-0.391
-3.08%
jan 1, 1975
10.6
-1.715
-13.92%
jan 1, 1976
10.474
-0.126
-1.18%
jan 1, 1977
8.176
-2.299
-21.95%
jan 1, 1978
9.781
+1.605
19.63%
jan 1, 1979
10.519
+0.738
7.55%
jan 1, 1980
12.406
+1.887
17.94%
jan 1, 1981
11.099
-1.307
-10.53%
jan 1, 1982
9.716
-1.383
-12.46%
jan 1, 1983
8.493
-1.223
-12.59%
jan 1, 1984
6.767
-1.726
-20.32%
jan 1, 1985
4.899
-1.868
-27.61%
jan 1, 1986
-1.553
-6.452
-131.71%
jan 1, 1987
-5.927
-4.373
281.55%
jan 1, 1988
-6.891
-0.964
16.26%
jan 1, 1989
-6.899
-0.008
0.12%
jan 1, 1990
-6.364
+0.535
-7.75%
jan 1, 1991
-5.54
+0.824
-12.95%
jan 1, 1992
-3.809
+1.731
-31.25%
jan 1, 1993
-1.196
+2.613
-68.6%
jan 1, 1994
-3.126
-1.93
161.38%
jan 1, 1995
-3.645
-0.519
16.61%
jan 1, 1996
-4.544
-0.899
24.67%
jan 1, 1997
-2.837
+1.707
-37.56%
jan 1, 1998
-4.213
-1.376
48.48%
jan 1, 1999
-1.348
+2.864
-68.0%
jan 1, 2000
-2.971
-1.623
120.37%
jan 1, 2001
-4.57
-1.599
53.82%
jan 1, 2002
-12.818
-8.247
180.45%
jan 1, 2003
-11.459
+1.359
-10.6%
jan 1, 2004
-12.61
-1.151
10.04%
jan 1, 2005
-11.535
+1.075
-8.52%
jan 1, 2006
-11.457
+0.078
-0.67%
jan 1, 2007
-4.12
+7.337
-64.04%
jan 1, 2008
-4.027
+0.094
-2.27%
jan 1, 2009
-13.72
-9.693
240.72%
jan 1, 2010
-16.5
-2.78
20.26%
jan 1, 2011
-17.982
-1.482
8.98%
jan 1, 2012
-15.983
+1.999
-11.12%
jan 1, 2013
-16.233
-0.251
1.57%
jan 1, 2014
-13.03
+3.203
-19.73%
jan 1, 2015
-10.722
+2.308
-17.72%
jan 1, 2016
-11.067
-0.345
3.22%
Ranking of countries by current statistics by years


Comments: