29
/
en
AIzaSyAYiBZKx7MnpbEhh9jyipgxe19OcubqV5w
April 1, 2024
257104
Switzerland
CHE
true
2
1
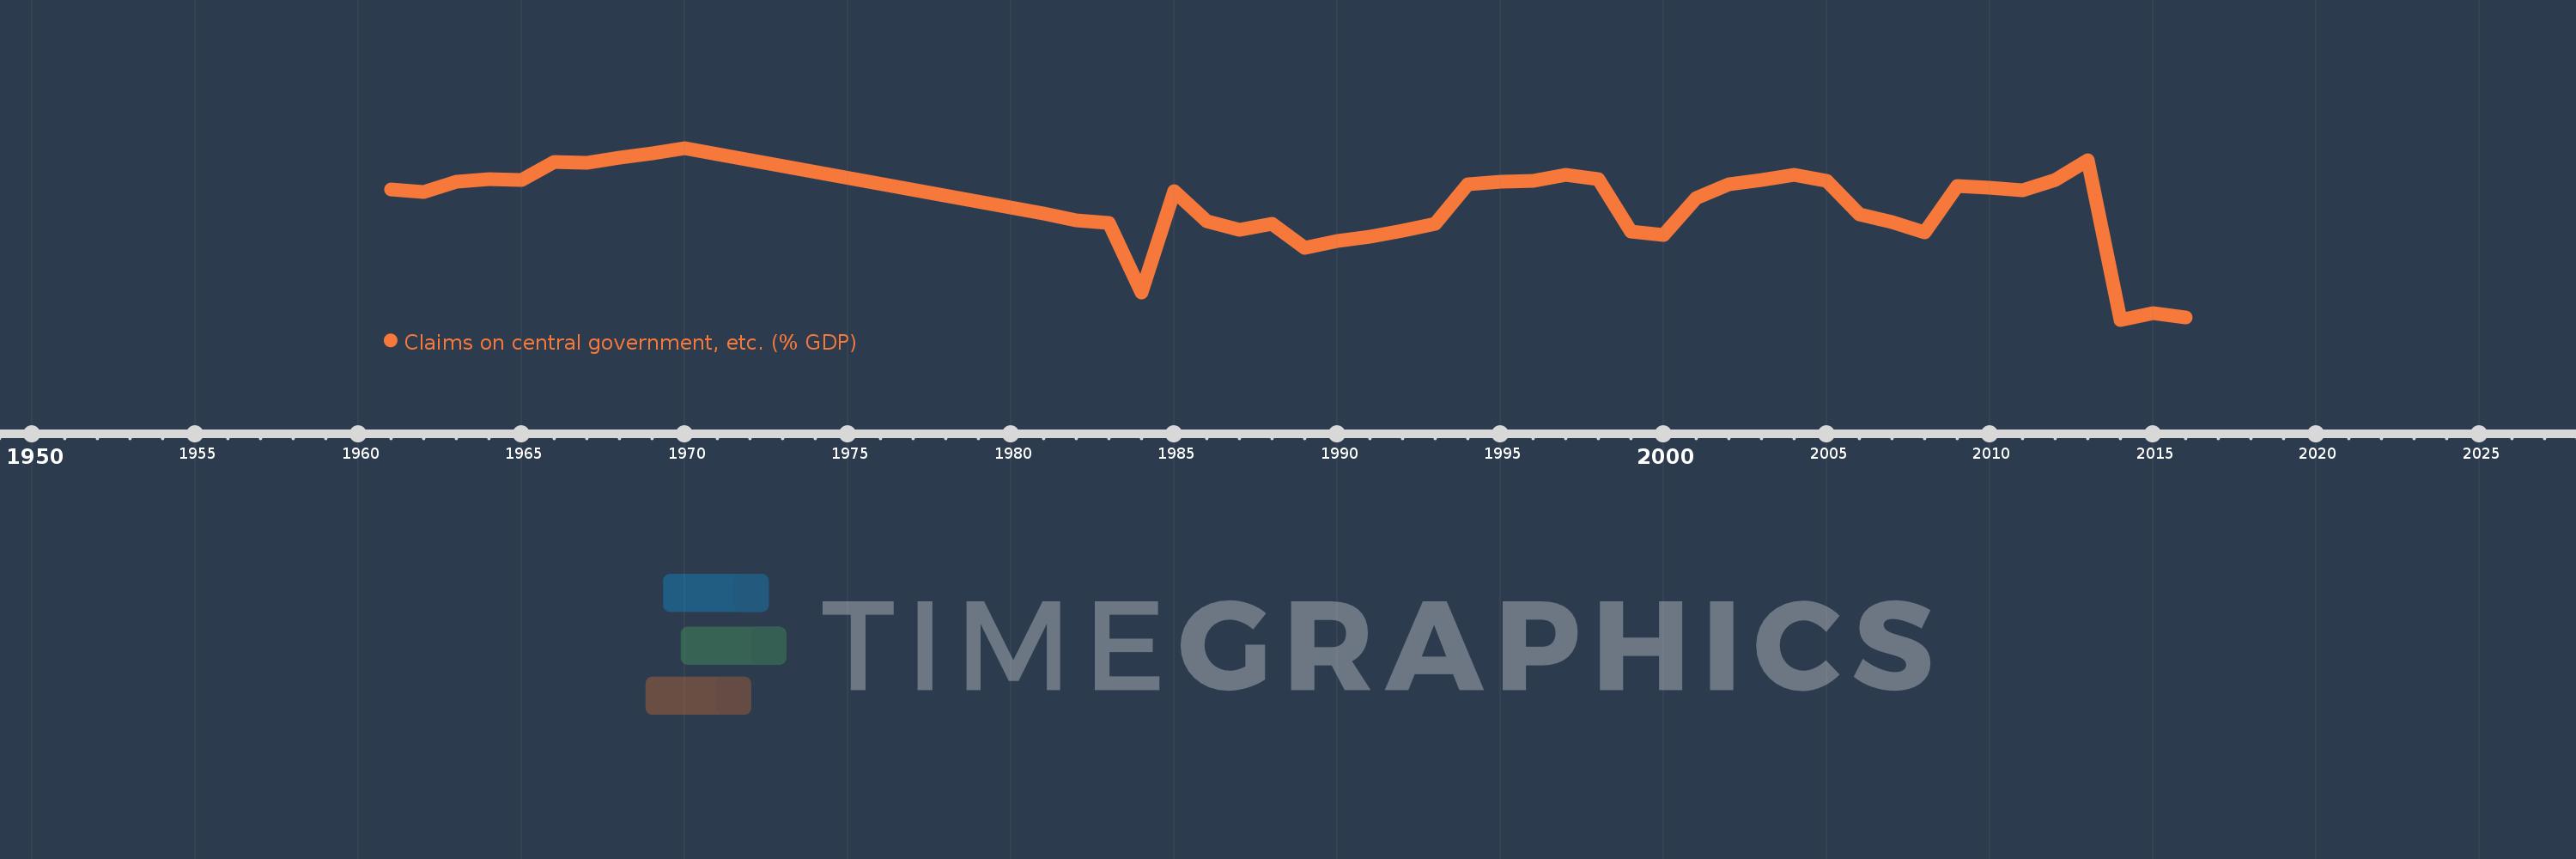
Claims on central government, etc. (% GDP)
2016,2015,2014,2013,2012,2011,2010,2009,2008,2007,2006,2005,2004,2003,2002,2001,2000,1999,1998,1997,1996,1995,1994,1993,1992,1991,1990,1989,1988,1987,1986,1985,1984,1983,1982,1981,1970,1969,1968,1967,1966,1965,1964,1963,1962,1961
This statistics in other country:
AfghanistanAlbaniaAlgeriaAngolaAntigua and BarbudaArab WorldArgentinaArmeniaArubaAustraliaAustriaAzerbaijanBahamas, TheBahrainBangladeshBarbadosBelarusBelgiumBelizeBeninBhutanBoliviaBosnia and HerzegovinaBotswanaBrazilBrunei DarussalamBulgariaBurkina FasoBurundiCabo VerdeCambodiaCameroonCanadaCaribbean small statesCentral African RepublicCentral Europe and the BalticsChadChileChinaColombiaComorosCongo, Dem. Rep.Congo, Rep.Costa RicaCote d'IvoireCroatiaCyprusCzech RepublicDenmarkDjiboutiDominicaDominican RepublicEarly-demographic dividendEast Asia & PacificEast Asia & Pacific (excluding high income)East Asia & Pacific (IDA & IBRD countries)EcuadorEgypt, Arab Rep.El SalvadorEquatorial GuineaEritreaEstoniaEthiopiaEuro areaEurope & Central AsiaEurope & Central Asia (excluding high income)Europe & Central Asia (IDA & IBRD countries)European UnionFijiFinlandFragile and conflict affected situationsFranceGabonGambia, TheGeorgiaGermanyGhanaGreeceGrenadaGuatemalaGuineaGuinea-BissauGuyanaHaitiHeavily indebted poor countries (HIPC)High incomeHondurasHong Kong SAR, ChinaHungaryIBRD onlyIcelandIDA & IBRD totalIDA blendIDA onlyIDA totalIndiaIndonesiaIran, Islamic Rep.IraqIrelandIsraelItalyJamaicaJapanJordanKazakhstanKenyaKorea, Rep.KosovoKuwaitKyrgyz RepublicLao PDRLate-demographic dividendLatin America & Caribbean Latin America & Caribbean (excluding high income)Latin America & the Caribbean (IDA & IBRD countries)LatviaLeast developed countries: UN classificationLebanonLesothoLiberiaLibyaLithuaniaLow & middle incomeLow incomeLower middle incomeLuxembourgMacao SAR, ChinaMacedonia, FYRMadagascarMalawiMalaysiaMaldivesMaliMaltaMauritaniaMauritiusMexicoMicronesia, Fed. Sts.Middle East & North AfricaMiddle East & North Africa (excluding high income)Middle East & North Africa (IDA & IBRD countries)Middle incomeMoldovaMongoliaMontenegroMoroccoMozambiqueMyanmarNamibiaNepalNetherlandsNew ZealandNicaraguaNigerNigeriaNorth AmericaNorwayOECD membersOmanOther small statesPacific island small statesPakistanPanamaPapua New GuineaParaguayPeruPhilippinesPolandPortugalPost-demographic dividendPre-demographic dividendQatarRomaniaRussian FederationRwandaSamoaSao Tome and PrincipeSaudi ArabiaSenegalSerbiaSeychellesSierra LeoneSingaporeSlovak RepublicSloveniaSmall statesSolomon IslandsSouth AfricaSouth AsiaSouth Asia (IDA & IBRD)South SudanSpainSri LankaSt. Kitts and NevisSt. LuciaSt. Vincent and the GrenadinesSub-Saharan Africa Sub-Saharan Africa (excluding high income)Sub-Saharan Africa (IDA & IBRD countries)SudanSurinameSwazilandSwedenSwitzerlandSyrian Arab RepublicTajikistanTanzaniaThailandTimor-LesteTogoTongaTrinidad and TobagoTunisiaTurkeyUgandaUkraineUnited Arab EmiratesUnited KingdomUnited StatesUpper middle incomeUruguayVanuatuVenezuela, RBVietnamWest Bank and GazaWorldYemen, Rep.ZambiaZimbabwe Timeline:
This timeline shows a graph from 1961 to 2016 of Switzerland. No data until 1960. Number of actual observations by date: 46.
Source name:
World Development Indicators
Source organization:
International Monetary Fund, International Financial Statistics and data files, and World Bank and OECD GDP estimates.
Categories, topics:
Financial Sector
Last updated:
apr 23, 2017
Indicators value changes by year
Maximum:
15.734
jan 1, 1970
At the date of observation
Value
Absolute change
Change from previous value
jan 1, 1961
12.948
+12.948
0.0%
jan 1, 1962
12.795
-0.153
-1.18%
jan 1, 1963
13.517
+0.722
5.64%
jan 1, 1964
13.636
+0.12
0.89%
jan 1, 1965
13.606
-0.03
-0.22%
jan 1, 1966
14.819
+1.212
8.91%
jan 1, 1967
14.734
-0.085
-0.58%
jan 1, 1968
15.09
+0.356
2.42%
jan 1, 1969
15.388
+0.299
1.98%
jan 1, 1970
15.734
+0.346
2.25%
jan 1, 1981
11.397
-4.337
-27.57%
jan 1, 1982
10.899
-0.498
-4.37%
jan 1, 1983
10.769
-0.13
-1.19%
jan 1, 1984
6.142
-4.627
-42.97%
jan 1, 1985
12.885
+6.743
109.79%
jan 1, 1986
10.84
-2.045
-15.87%
jan 1, 1987
10.289
-0.551
-5.09%
jan 1, 1988
10.671
+0.383
3.72%
jan 1, 1989
9.071
-1.6
-14.99%
jan 1, 1990
9.526
+0.454
5.01%
jan 1, 1991
9.841
+0.315
3.31%
jan 1, 1992
10.236
+0.395
4.02%
jan 1, 1993
10.687
+0.451
4.4%
jan 1, 1994
13.329
+2.642
24.72%
jan 1, 1995
13.511
+0.182
1.37%
jan 1, 1996
13.553
+0.043
0.32%
jan 1, 1997
13.953
+0.399
2.95%
jan 1, 1998
13.675
-0.277
-1.99%
jan 1, 1999
10.182
-3.493
-25.55%
jan 1, 2000
9.975
-0.207
-2.03%
jan 1, 2001
12.377
+2.403
24.09%
jan 1, 2002
13.316
+0.939
7.58%
jan 1, 2003
13.625
+0.309
2.32%
jan 1, 2004
13.942
+0.317
2.33%
jan 1, 2005
13.528
-0.414
-2.97%
jan 1, 2006
11.334
-2.194
-16.22%
jan 1, 2007
10.831
-0.503
-4.44%
jan 1, 2008
10.109
-0.722
-6.67%
jan 1, 2009
13.197
+3.088
30.55%
jan 1, 2010
13.093
-0.105
-0.79%
jan 1, 2011
12.91
-0.183
-1.4%
jan 1, 2012
13.608
+0.699
5.41%
jan 1, 2013
14.895
+1.287
9.46%
jan 1, 2014
4.309
-10.587
-71.07%
jan 1, 2015
4.752
+0.443
10.28%
jan 1, 2016
4.469
-0.283
-5.96%
Ranking of countries by current statistics by years


Comments: