29
/
en
AIzaSyAYiBZKx7MnpbEhh9jyipgxe19OcubqV5w
April 1, 2024
274589
United Arab Emirates
ARE
true
2
1
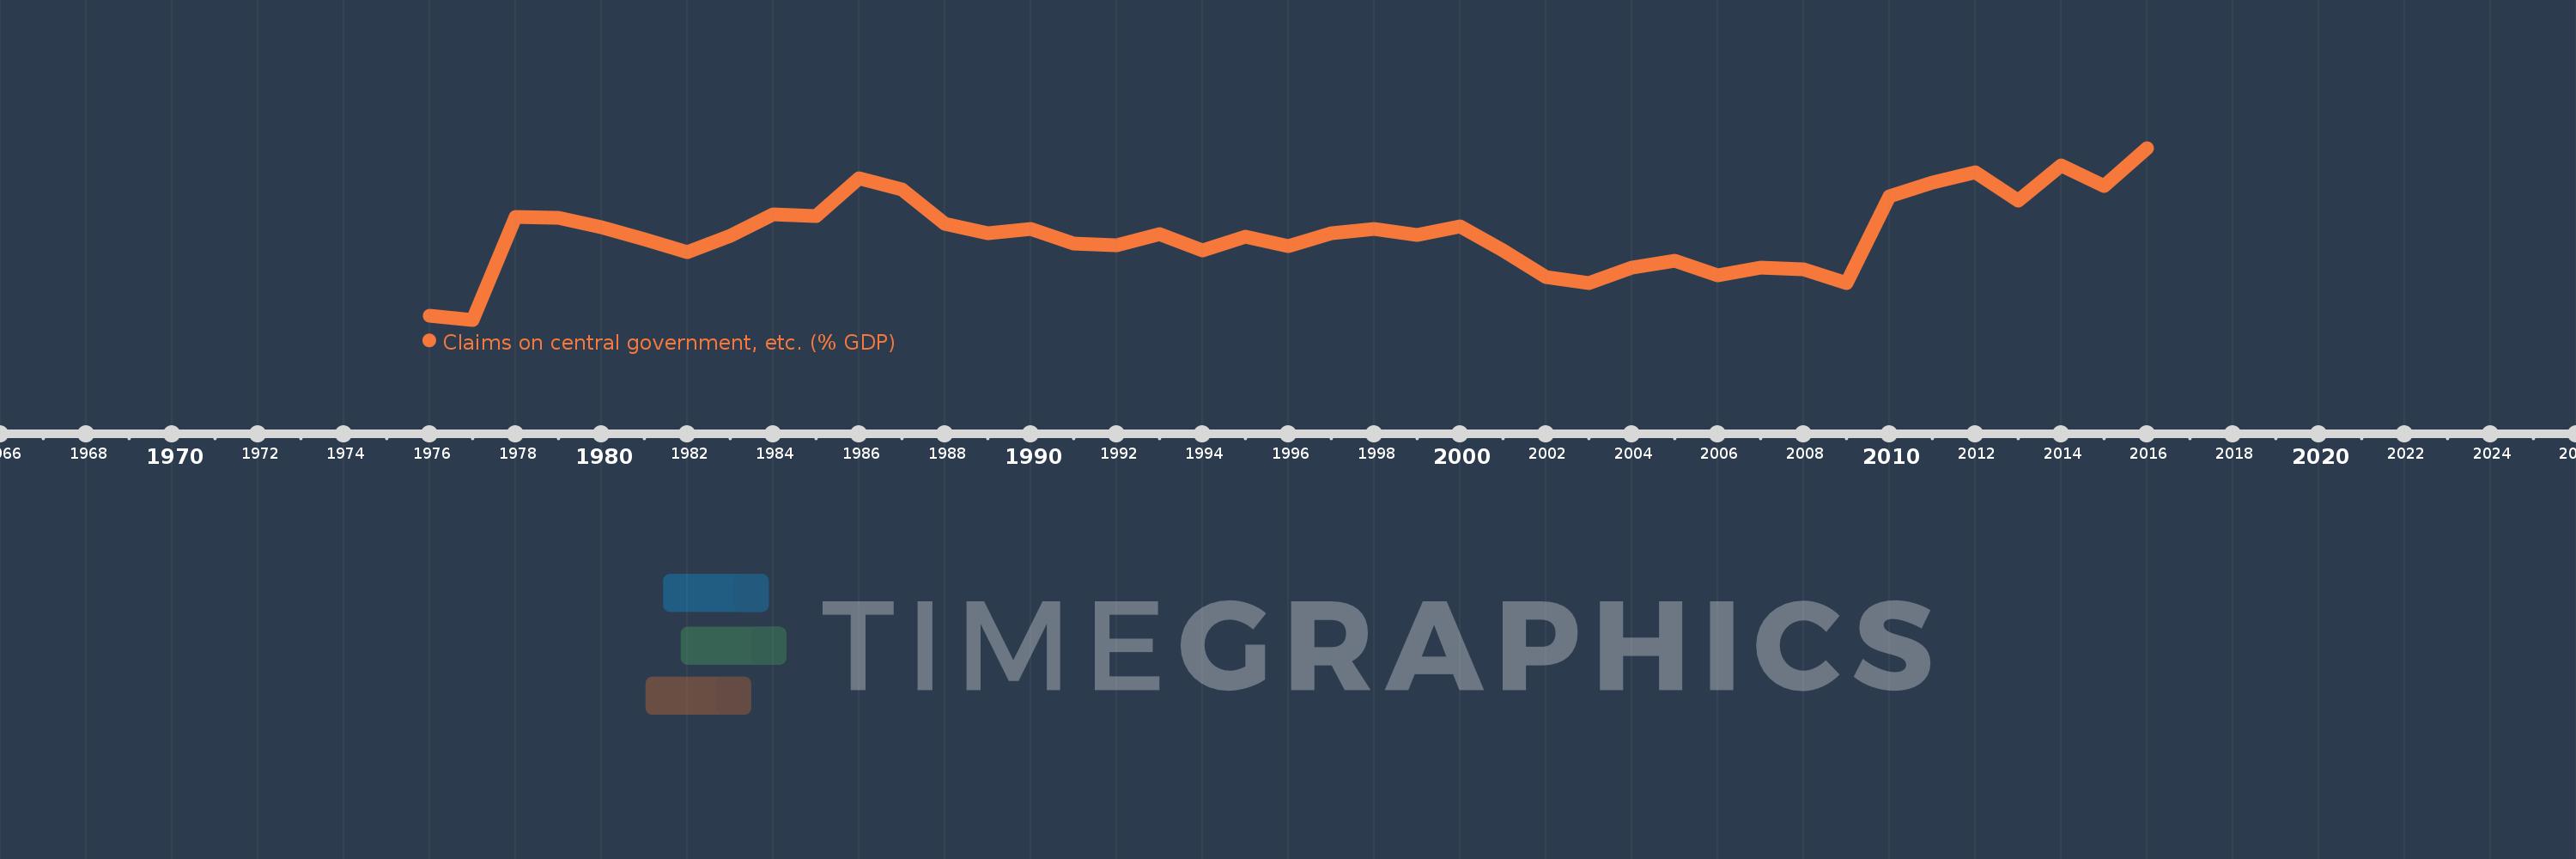
Claims on central government, etc. (% GDP)
2016,2015,2014,2013,2012,2011,2010,2009,2008,2007,2006,2005,2004,2003,2002,2001,2000,1999,1998,1997,1996,1995,1994,1993,1992,1991,1990,1989,1988,1987,1986,1985,1984,1983,1982,1981,1980,1979,1978,1977,1976
This statistics in other country:
AfghanistanAlbaniaAlgeriaAngolaAntigua and BarbudaArab WorldArgentinaArmeniaArubaAustraliaAustriaAzerbaijanBahamas, TheBahrainBangladeshBarbadosBelarusBelgiumBelizeBeninBhutanBoliviaBosnia and HerzegovinaBotswanaBrazilBrunei DarussalamBulgariaBurkina FasoBurundiCabo VerdeCambodiaCameroonCanadaCaribbean small statesCentral African RepublicCentral Europe and the BalticsChadChileChinaColombiaComorosCongo, Dem. Rep.Congo, Rep.Costa RicaCote d'IvoireCroatiaCyprusCzech RepublicDenmarkDjiboutiDominicaDominican RepublicEarly-demographic dividendEast Asia & PacificEast Asia & Pacific (excluding high income)East Asia & Pacific (IDA & IBRD countries)EcuadorEgypt, Arab Rep.El SalvadorEquatorial GuineaEritreaEstoniaEthiopiaEuro areaEurope & Central AsiaEurope & Central Asia (excluding high income)Europe & Central Asia (IDA & IBRD countries)European UnionFijiFinlandFragile and conflict affected situationsFranceGabonGambia, TheGeorgiaGermanyGhanaGreeceGrenadaGuatemalaGuineaGuinea-BissauGuyanaHaitiHeavily indebted poor countries (HIPC)High incomeHondurasHong Kong SAR, ChinaHungaryIBRD onlyIcelandIDA & IBRD totalIDA blendIDA onlyIDA totalIndiaIndonesiaIran, Islamic Rep.IraqIrelandIsraelItalyJamaicaJapanJordanKazakhstanKenyaKorea, Rep.KosovoKuwaitKyrgyz RepublicLao PDRLate-demographic dividendLatin America & Caribbean Latin America & Caribbean (excluding high income)Latin America & the Caribbean (IDA & IBRD countries)LatviaLeast developed countries: UN classificationLebanonLesothoLiberiaLibyaLithuaniaLow & middle incomeLow incomeLower middle incomeLuxembourgMacao SAR, ChinaMacedonia, FYRMadagascarMalawiMalaysiaMaldivesMaliMaltaMauritaniaMauritiusMexicoMicronesia, Fed. Sts.Middle East & North AfricaMiddle East & North Africa (excluding high income)Middle East & North Africa (IDA & IBRD countries)Middle incomeMoldovaMongoliaMontenegroMoroccoMozambiqueMyanmarNamibiaNepalNetherlandsNew ZealandNicaraguaNigerNigeriaNorth AmericaNorwayOECD membersOmanOther small statesPacific island small statesPakistanPanamaPapua New GuineaParaguayPeruPhilippinesPolandPortugalPost-demographic dividendPre-demographic dividendQatarRomaniaRussian FederationRwandaSamoaSao Tome and PrincipeSaudi ArabiaSenegalSerbiaSeychellesSierra LeoneSingaporeSlovak RepublicSloveniaSmall statesSolomon IslandsSouth AfricaSouth AsiaSouth Asia (IDA & IBRD)South SudanSpainSri LankaSt. Kitts and NevisSt. LuciaSt. Vincent and the GrenadinesSub-Saharan Africa Sub-Saharan Africa (excluding high income)Sub-Saharan Africa (IDA & IBRD countries)SudanSurinameSwazilandSwedenSwitzerlandSyrian Arab RepublicTajikistanTanzaniaThailandTimor-LesteTogoTongaTrinidad and TobagoTunisiaTurkeyUgandaUkraineUnited Arab EmiratesUnited KingdomUnited StatesUpper middle incomeUruguayVanuatuVenezuela, RBVietnamWest Bank and GazaWorldYemen, Rep.ZambiaZimbabwe Timeline:
This timeline shows a graph from 1976 to 2016 of United Arab Emirates. No data until 1975. Number of actual observations by date: 41.
Source name:
World Development Indicators
Source organization:
International Monetary Fund, International Financial Statistics and data files, and World Bank and OECD GDP estimates.
Categories, topics:
Financial Sector
Last updated:
apr 23, 2017
Indicators value changes by year
Minimum:
-11.245
jan 1, 1977
At the date of observation
Value
Absolute change
Change from previous value
jan 1, 1976
-10.879
-10.879
0.0%
jan 1, 1977
-11.245
-0.366
3.36%
jan 1, 1978
-1.489
+9.756
-86.76%
jan 1, 1979
-1.62
-0.131
8.77%
jan 1, 1980
-2.485
-0.865
53.43%
jan 1, 1981
-3.652
-1.167
46.97%
jan 1, 1982
-4.874
-1.221
33.44%
jan 1, 1983
-3.301
+1.573
-32.28%
jan 1, 1984
-1.225
+2.076
-62.89%
jan 1, 1985
-1.403
-0.178
14.54%
jan 1, 1986
2.17
+3.573
-254.73%
jan 1, 1987
1.056
-1.115
-51.36%
jan 1, 1988
-2.183
-3.238
-306.73%
jan 1, 1989
-3.042
-0.859
39.37%
jan 1, 1990
-2.63
+0.412
-13.54%
jan 1, 1991
-4.002
-1.372
52.16%
jan 1, 1992
-4.197
-0.196
4.89%
jan 1, 1993
-3.126
+1.071
-25.51%
jan 1, 1994
-4.665
-1.539
49.22%
jan 1, 1995
-3.378
+1.287
-27.59%
jan 1, 1996
-4.314
-0.936
27.71%
jan 1, 1997
-3.056
+1.258
-29.15%
jan 1, 1998
-2.635
+0.421
-13.77%
jan 1, 1999
-3.228
-0.592
22.48%
jan 1, 2000
-2.427
+0.801
-24.81%
jan 1, 2001
-4.715
-2.288
94.27%
jan 1, 2002
-7.234
-2.52
53.44%
jan 1, 2003
-7.801
-0.567
7.84%
jan 1, 2004
-6.336
+1.465
-18.78%
jan 1, 2005
-5.645
+0.691
-10.9%
jan 1, 2006
-7.061
-1.416
25.08%
jan 1, 2007
-6.319
+0.743
-10.52%
jan 1, 2008
-6.456
-0.137
2.17%
jan 1, 2009
-7.791
-1.335
20.69%
jan 1, 2010
0.407
+8.198
-105.22%
jan 1, 2011
1.728
+1.321
324.77%
jan 1, 2012
2.761
+1.034
59.85%
jan 1, 2013
0.011
-2.75
-99.6%
jan 1, 2014
3.334
+3.323
30.18K%
jan 1, 2015
1.456
-1.877
-56.32%
jan 1, 2016
5.024
+3.568
244.98%
Ranking of countries by current statistics by years


Comments: