29
/
en
AIzaSyAYiBZKx7MnpbEhh9jyipgxe19OcubqV5w
April 1, 2024
103368
Chad
TCD
true
2
1
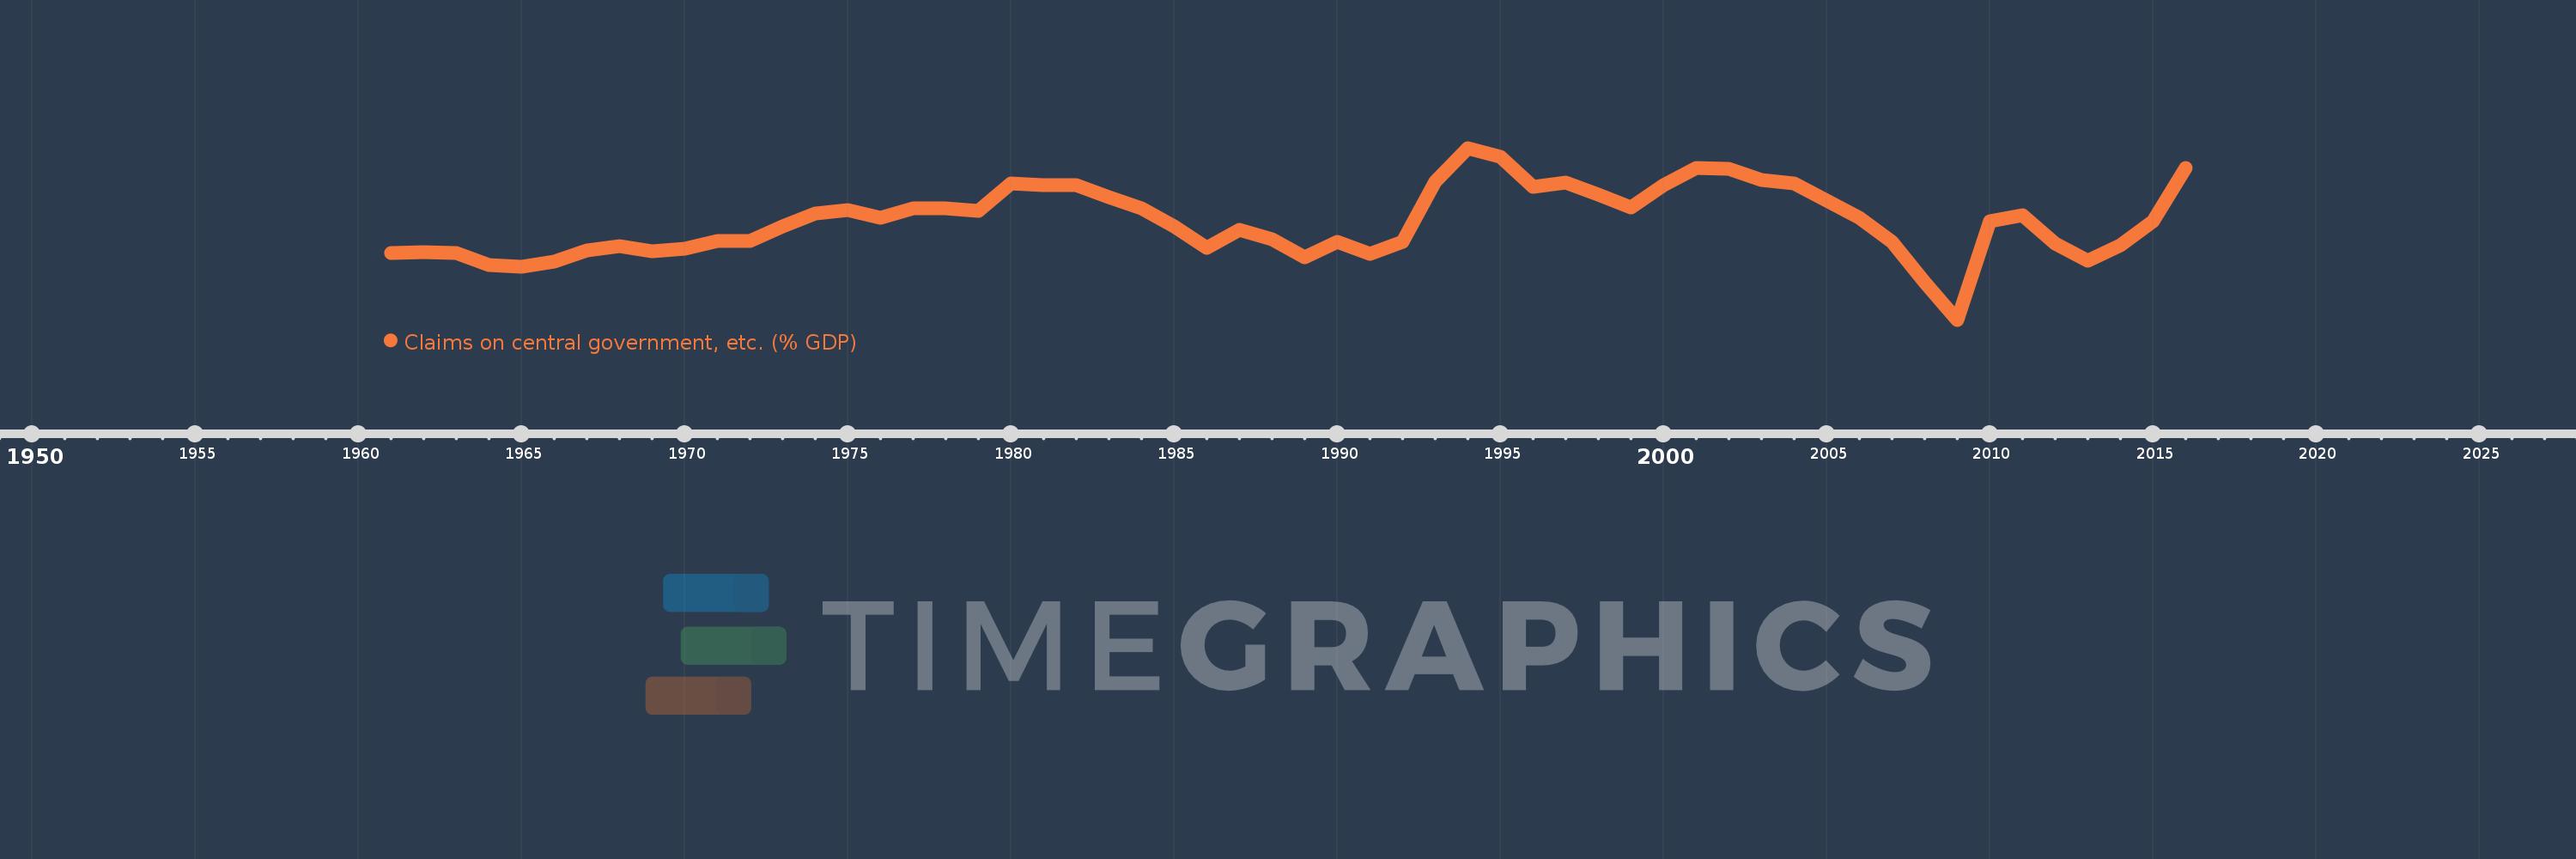
Claims on central government, etc. (% GDP)
2016,2015,2014,2013,2012,2011,2010,2009,2008,2007,2006,2005,2004,2003,2002,2001,2000,1999,1998,1997,1996,1995,1994,1993,1992,1991,1990,1989,1988,1987,1986,1985,1984,1983,1982,1981,1980,1979,1978,1977,1976,1975,1974,1973,1972,1971,1970,1969,1968,1967,1966,1965,1964,1963,1962,1961
This statistics in other country:
AfghanistanAlbaniaAlgeriaAngolaAntigua and BarbudaArab WorldArgentinaArmeniaArubaAustraliaAustriaAzerbaijanBahamas, TheBahrainBangladeshBarbadosBelarusBelgiumBelizeBeninBhutanBoliviaBosnia and HerzegovinaBotswanaBrazilBrunei DarussalamBulgariaBurkina FasoBurundiCabo VerdeCambodiaCameroonCanadaCaribbean small statesCentral African RepublicCentral Europe and the BalticsChadChileChinaColombiaComorosCongo, Dem. Rep.Congo, Rep.Costa RicaCote d'IvoireCroatiaCyprusCzech RepublicDenmarkDjiboutiDominicaDominican RepublicEarly-demographic dividendEast Asia & PacificEast Asia & Pacific (excluding high income)East Asia & Pacific (IDA & IBRD countries)EcuadorEgypt, Arab Rep.El SalvadorEquatorial GuineaEritreaEstoniaEthiopiaEuro areaEurope & Central AsiaEurope & Central Asia (excluding high income)Europe & Central Asia (IDA & IBRD countries)European UnionFijiFinlandFragile and conflict affected situationsFranceGabonGambia, TheGeorgiaGermanyGhanaGreeceGrenadaGuatemalaGuineaGuinea-BissauGuyanaHaitiHeavily indebted poor countries (HIPC)High incomeHondurasHong Kong SAR, ChinaHungaryIBRD onlyIcelandIDA & IBRD totalIDA blendIDA onlyIDA totalIndiaIndonesiaIran, Islamic Rep.IraqIrelandIsraelItalyJamaicaJapanJordanKazakhstanKenyaKorea, Rep.KosovoKuwaitKyrgyz RepublicLao PDRLate-demographic dividendLatin America & Caribbean Latin America & Caribbean (excluding high income)Latin America & the Caribbean (IDA & IBRD countries)LatviaLeast developed countries: UN classificationLebanonLesothoLiberiaLibyaLithuaniaLow & middle incomeLow incomeLower middle incomeLuxembourgMacao SAR, ChinaMacedonia, FYRMadagascarMalawiMalaysiaMaldivesMaliMaltaMauritaniaMauritiusMexicoMicronesia, Fed. Sts.Middle East & North AfricaMiddle East & North Africa (excluding high income)Middle East & North Africa (IDA & IBRD countries)Middle incomeMoldovaMongoliaMontenegroMoroccoMozambiqueMyanmarNamibiaNepalNetherlandsNew ZealandNicaraguaNigerNigeriaNorth AmericaNorwayOECD membersOmanOther small statesPacific island small statesPakistanPanamaPapua New GuineaParaguayPeruPhilippinesPolandPortugalPost-demographic dividendPre-demographic dividendQatarRomaniaRussian FederationRwandaSamoaSao Tome and PrincipeSaudi ArabiaSenegalSerbiaSeychellesSierra LeoneSingaporeSlovak RepublicSloveniaSmall statesSolomon IslandsSouth AfricaSouth AsiaSouth Asia (IDA & IBRD)South SudanSpainSri LankaSt. Kitts and NevisSt. LuciaSt. Vincent and the GrenadinesSub-Saharan Africa Sub-Saharan Africa (excluding high income)Sub-Saharan Africa (IDA & IBRD countries)SudanSurinameSwazilandSwedenSwitzerlandSyrian Arab RepublicTajikistanTanzaniaThailandTimor-LesteTogoTongaTrinidad and TobagoTunisiaTurkeyUgandaUkraineUnited Arab EmiratesUnited KingdomUnited StatesUpper middle incomeUruguayVanuatuVenezuela, RBVietnamWest Bank and GazaWorldYemen, Rep.ZambiaZimbabwe Timeline:
This timeline shows a graph from 1961 to 2016 of Chad. No data until 1960. Number of actual observations by date: 56.
Source name:
World Development Indicators
Source organization:
International Monetary Fund, International Financial Statistics and data files, and World Bank and OECD GDP estimates.
Categories, topics:
Financial Sector
Last updated:
apr 23, 2017
Indicators value changes by year
Minimum:
-5.151
jan 1, 2009
At the date of observation
Value
Absolute change
Change from previous value
jan 1, 1961
-0.026
-0.026
0.0%
jan 1, 1962
0.049
+0.075
-287.74%
jan 1, 1963
-0.068
-0.117
-240.22%
jan 1, 1964
-0.977
-0.909
1.33K%
jan 1, 1965
-1.124
-0.147
15.01%
jan 1, 1966
-0.675
+0.448
-39.9%
jan 1, 1967
0.179
+0.854
-126.46%
jan 1, 1968
0.479
+0.3
168.03%
jan 1, 1969
0.072
-0.407
-84.95%
jan 1, 1970
0.275
+0.203
281.38%
jan 1, 1971
0.893
+0.618
224.79%
jan 1, 1972
0.893
+0.0
0.05%
jan 1, 1973
1.96
+1.067
119.41%
jan 1, 1974
2.961
+1.001
51.09%
jan 1, 1975
3.255
+0.294
9.94%
jan 1, 1976
2.658
-0.597
-18.34%
jan 1, 1977
3.335
+0.677
25.46%
jan 1, 1978
3.373
+0.037
1.12%
jan 1, 1979
3.187
-0.186
-5.51%
jan 1, 1980
5.252
+2.065
64.81%
jan 1, 1981
5.132
-0.12
-2.29%
jan 1, 1982
5.17
+0.038
0.75%
jan 1, 1983
4.238
-0.932
-18.03%
jan 1, 1984
3.383
-0.855
-20.18%
jan 1, 1985
1.992
-1.391
-41.11%
jan 1, 1986
0.323
-1.669
-83.79%
jan 1, 1987
1.747
+1.424
440.79%
jan 1, 1988
0.999
-0.747
-42.79%
jan 1, 1989
-0.394
-1.393
-139.41%
jan 1, 1990
0.778
+1.172
-297.49%
jan 1, 1991
-0.14
-0.918
-118.06%
jan 1, 1992
0.837
+0.977
-695.75%
jan 1, 1993
5.426
+4.589
548.33%
jan 1, 1994
7.981
+2.555
47.09%
jan 1, 1995
7.319
-0.663
-8.3%
jan 1, 1996
5.027
-2.292
-31.31%
jan 1, 1997
5.339
+0.312
6.2%
jan 1, 1998
4.443
-0.896
-16.78%
jan 1, 1999
3.447
-0.996
-22.42%
jan 1, 2000
5.14
+1.693
49.13%
jan 1, 2001
6.483
+1.343
26.12%
jan 1, 2002
6.376
-0.108
-1.66%
jan 1, 2003
5.54
-0.835
-13.1%
jan 1, 2004
5.28
-0.261
-4.7%
jan 1, 2005
3.925
-1.355
-25.67%
jan 1, 2006
2.672
-1.253
-31.92%
jan 1, 2007
0.796
-1.876
-70.23%
jan 1, 2008
-2.284
-3.08
-387.16%
jan 1, 2009
-5.151
-2.867
125.49%
jan 1, 2010
2.399
+7.55
-146.58%
jan 1, 2011
2.831
+0.432
18.0%
jan 1, 2012
0.691
-2.141
-75.61%
jan 1, 2013
-0.647
-1.338
-193.75%
jan 1, 2014
0.558
+1.205
-186.2%
jan 1, 2015
2.406
+1.848
331.15%
jan 1, 2016
6.48
+4.074
169.32%
Ranking of countries by current statistics by years


Comments: