29
/
en
AIzaSyAYiBZKx7MnpbEhh9jyipgxe19OcubqV5w
April 1, 2024
35585
High income
HIC
false
2
1
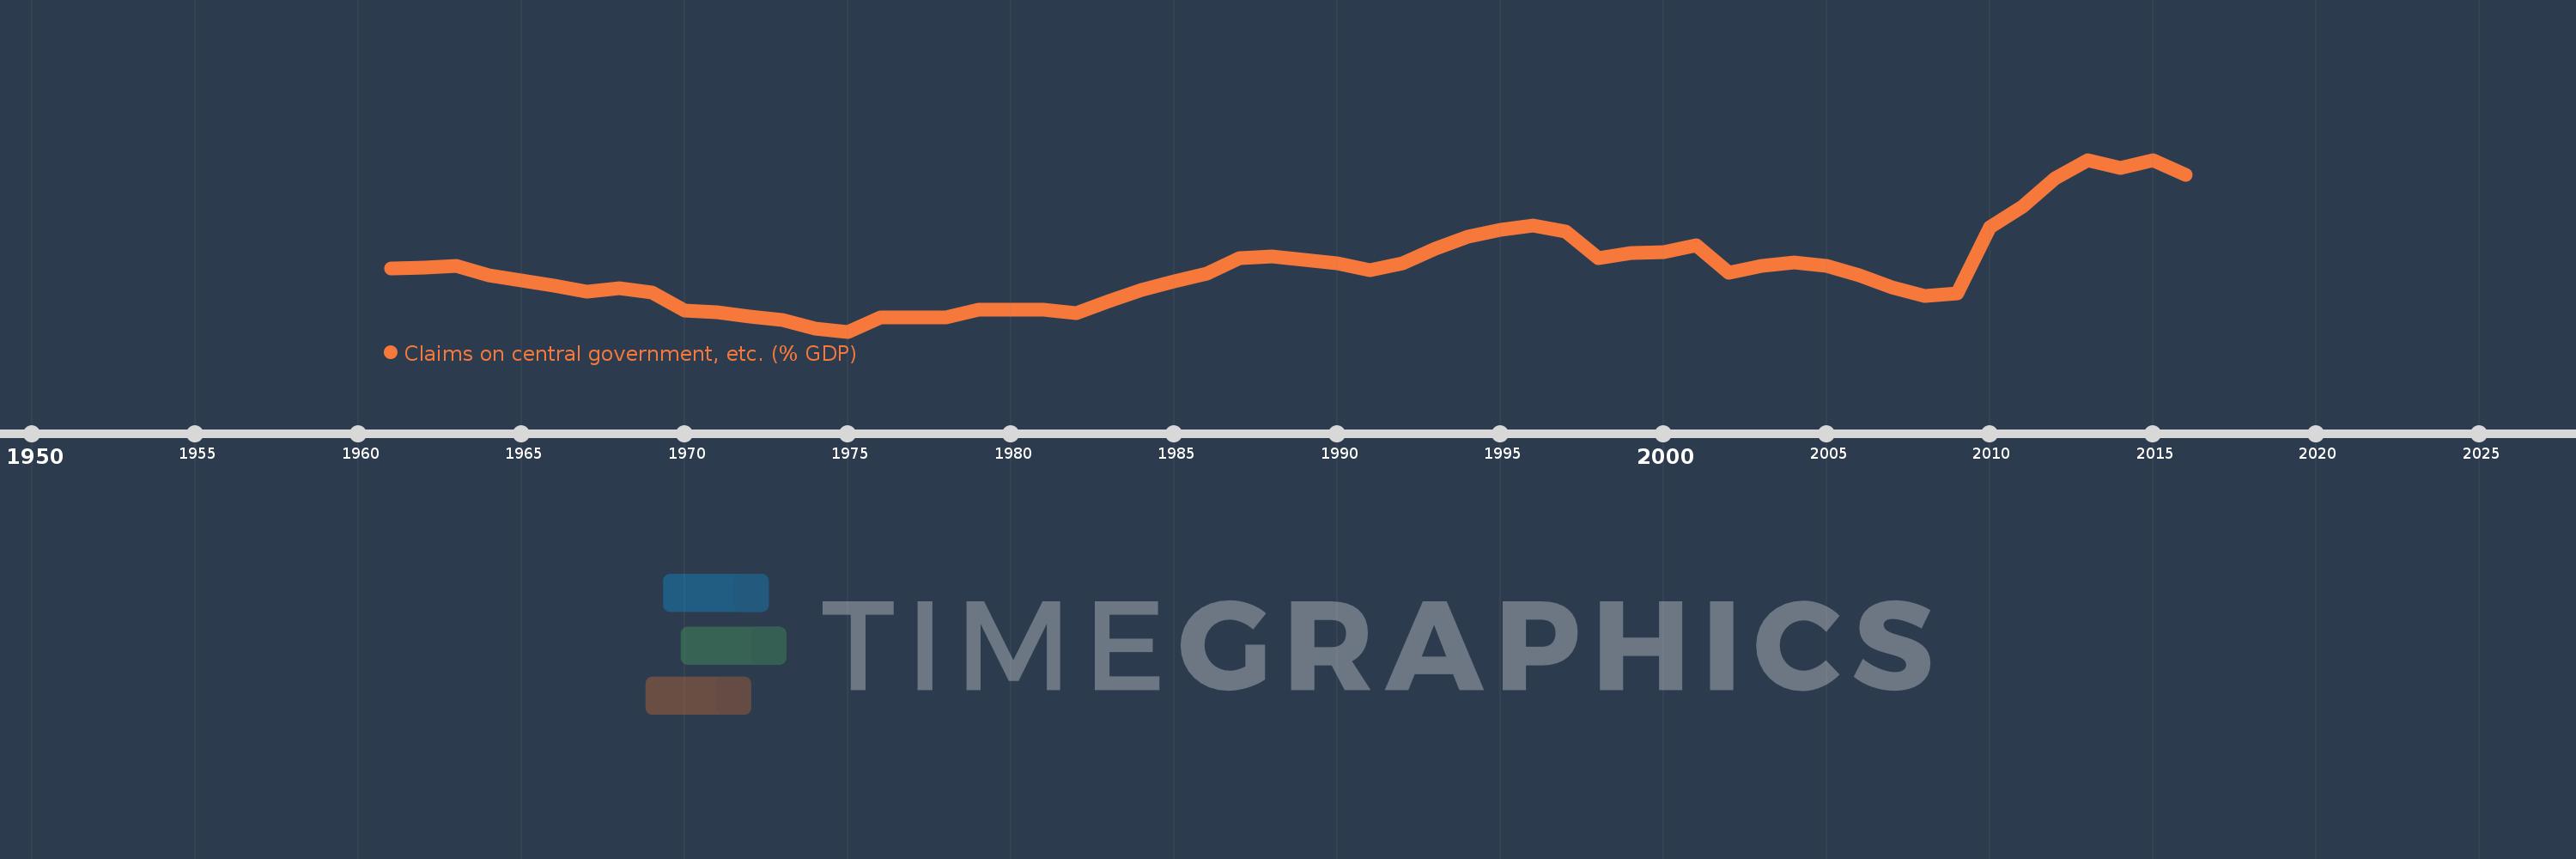
Claims on central government, etc. (% GDP)
2016,2015,2014,2013,2012,2011,2010,2009,2008,2007,2006,2005,2004,2003,2002,2001,2000,1999,1998,1997,1996,1995,1994,1993,1992,1991,1990,1989,1988,1987,1986,1985,1984,1983,1982,1981,1980,1979,1978,1977,1976,1975,1974,1973,1972,1971,1970,1969,1968,1967,1966,1965,1964,1963,1962,1961
This statistics in other country:
AfghanistanAlbaniaAlgeriaAngolaAntigua and BarbudaArab WorldArgentinaArmeniaArubaAustraliaAustriaAzerbaijanBahamas, TheBahrainBangladeshBarbadosBelarusBelgiumBelizeBeninBhutanBoliviaBosnia and HerzegovinaBotswanaBrazilBrunei DarussalamBulgariaBurkina FasoBurundiCabo VerdeCambodiaCameroonCanadaCaribbean small statesCentral African RepublicCentral Europe and the BalticsChadChileChinaColombiaComorosCongo, Dem. Rep.Congo, Rep.Costa RicaCote d'IvoireCroatiaCyprusCzech RepublicDenmarkDjiboutiDominicaDominican RepublicEarly-demographic dividendEast Asia & PacificEast Asia & Pacific (excluding high income)East Asia & Pacific (IDA & IBRD countries)EcuadorEgypt, Arab Rep.El SalvadorEquatorial GuineaEritreaEstoniaEthiopiaEuro areaEurope & Central AsiaEurope & Central Asia (excluding high income)Europe & Central Asia (IDA & IBRD countries)European UnionFijiFinlandFragile and conflict affected situationsFranceGabonGambia, TheGeorgiaGermanyGhanaGreeceGrenadaGuatemalaGuineaGuinea-BissauGuyanaHaitiHeavily indebted poor countries (HIPC)High incomeHondurasHong Kong SAR, ChinaHungaryIBRD onlyIcelandIDA & IBRD totalIDA blendIDA onlyIDA totalIndiaIndonesiaIran, Islamic Rep.IraqIrelandIsraelItalyJamaicaJapanJordanKazakhstanKenyaKorea, Rep.KosovoKuwaitKyrgyz RepublicLao PDRLate-demographic dividendLatin America & Caribbean Latin America & Caribbean (excluding high income)Latin America & the Caribbean (IDA & IBRD countries)LatviaLeast developed countries: UN classificationLebanonLesothoLiberiaLibyaLithuaniaLow & middle incomeLow incomeLower middle incomeLuxembourgMacao SAR, ChinaMacedonia, FYRMadagascarMalawiMalaysiaMaldivesMaliMaltaMauritaniaMauritiusMexicoMicronesia, Fed. Sts.Middle East & North AfricaMiddle East & North Africa (excluding high income)Middle East & North Africa (IDA & IBRD countries)Middle incomeMoldovaMongoliaMontenegroMoroccoMozambiqueMyanmarNamibiaNepalNetherlandsNew ZealandNicaraguaNigerNigeriaNorth AmericaNorwayOECD membersOmanOther small statesPacific island small statesPakistanPanamaPapua New GuineaParaguayPeruPhilippinesPolandPortugalPost-demographic dividendPre-demographic dividendQatarRomaniaRussian FederationRwandaSamoaSao Tome and PrincipeSaudi ArabiaSenegalSerbiaSeychellesSierra LeoneSingaporeSlovak RepublicSloveniaSmall statesSolomon IslandsSouth AfricaSouth AsiaSouth Asia (IDA & IBRD)South SudanSpainSri LankaSt. Kitts and NevisSt. LuciaSt. Vincent and the GrenadinesSub-Saharan Africa Sub-Saharan Africa (excluding high income)Sub-Saharan Africa (IDA & IBRD countries)SudanSurinameSwazilandSwedenSwitzerlandSyrian Arab RepublicTajikistanTanzaniaThailandTimor-LesteTogoTongaTrinidad and TobagoTunisiaTurkeyUgandaUkraineUnited Arab EmiratesUnited KingdomUnited StatesUpper middle incomeUruguayVanuatuVenezuela, RBVietnamWest Bank and GazaWorldYemen, Rep.ZambiaZimbabwe Timeline:
This timeline shows a graph from 1961 to 2016 of High income. No data until 1960. Number of actual observations by date: 56.
Source name:
World Development Indicators
Source organization:
International Monetary Fund, International Financial Statistics and data files, and World Bank and OECD GDP estimates.
Categories, topics:
Financial Sector
Last updated:
apr 23, 2017
Indicators value changes by year
Minimum:
11.225
jan 1, 1975
Maximum:
35.829
jan 1, 2015
At the date of observation
Value
Absolute change
Change from previous value
jan 1, 1961
20.292
+20.292
0.0%
jan 1, 1962
20.347
+0.056
0.27%
jan 1, 1963
20.635
+0.288
1.41%
jan 1, 1964
19.242
-1.393
-6.75%
jan 1, 1965
18.512
-0.731
-3.8%
jan 1, 1966
17.78
-0.732
-3.95%
jan 1, 1967
16.886
-0.894
-5.03%
jan 1, 1968
17.466
+0.58
3.43%
jan 1, 1969
16.833
-0.634
-3.63%
jan 1, 1970
14.253
-2.58
-15.33%
jan 1, 1971
13.97
-0.283
-1.99%
jan 1, 1972
13.428
-0.542
-3.88%
jan 1, 1973
12.944
-0.483
-3.6%
jan 1, 1974
11.683
-1.261
-9.74%
jan 1, 1975
11.225
-0.458
-3.92%
jan 1, 1976
13.223
+1.998
17.8%
jan 1, 1977
13.315
+0.092
0.69%
jan 1, 1978
13.254
-0.061
-0.46%
jan 1, 1979
14.398
+1.145
8.64%
jan 1, 1980
14.31
-0.088
-0.61%
jan 1, 1981
14.378
+0.068
0.48%
jan 1, 1982
13.814
-0.564
-3.92%
jan 1, 1983
15.625
+1.811
13.11%
jan 1, 1984
17.226
+1.601
10.25%
jan 1, 1985
18.437
+1.211
7.03%
jan 1, 1986
19.551
+1.114
6.04%
jan 1, 1987
21.74
+2.189
11.2%
jan 1, 1988
21.938
+0.198
0.91%
jan 1, 1989
21.451
-0.488
-2.22%
jan 1, 1990
21.001
-0.45
-2.1%
jan 1, 1991
20.001
-1.0
-4.76%
jan 1, 1992
20.953
+0.952
4.76%
jan 1, 1993
23.035
+2.082
9.94%
jan 1, 1994
24.825
+1.789
7.77%
jan 1, 1995
25.754
+0.929
3.74%
jan 1, 1996
26.426
+0.672
2.61%
jan 1, 1997
25.544
-0.882
-3.34%
jan 1, 1998
21.775
-3.768
-14.75%
jan 1, 1999
22.489
+0.714
3.28%
jan 1, 2000
22.617
+0.128
0.57%
jan 1, 2001
23.648
+1.031
4.56%
jan 1, 2002
19.598
-4.05
-17.13%
jan 1, 2003
20.645
+1.048
5.35%
jan 1, 2004
21.111
+0.466
2.26%
jan 1, 2005
20.652
-0.459
-2.17%
jan 1, 2006
19.311
-1.34
-6.49%
jan 1, 2007
17.618
-1.693
-8.77%
jan 1, 2008
16.345
-1.273
-7.23%
jan 1, 2009
16.649
+0.304
1.86%
jan 1, 2010
26.178
+9.529
57.24%
jan 1, 2011
29.134
+2.956
11.29%
jan 1, 2012
33.138
+4.005
13.75%
jan 1, 2013
35.737
+2.599
7.84%
jan 1, 2014
34.709
-1.029
-2.88%
jan 1, 2015
35.829
+1.121
3.23%
jan 1, 2016
33.657
-2.172
-6.06%
Ranking of countries by current statistics by years


Comments: