29
/
en
AIzaSyAYiBZKx7MnpbEhh9jyipgxe19OcubqV5w
April 1, 2024
127195
Equatorial Guinea
GNQ
true
2
1
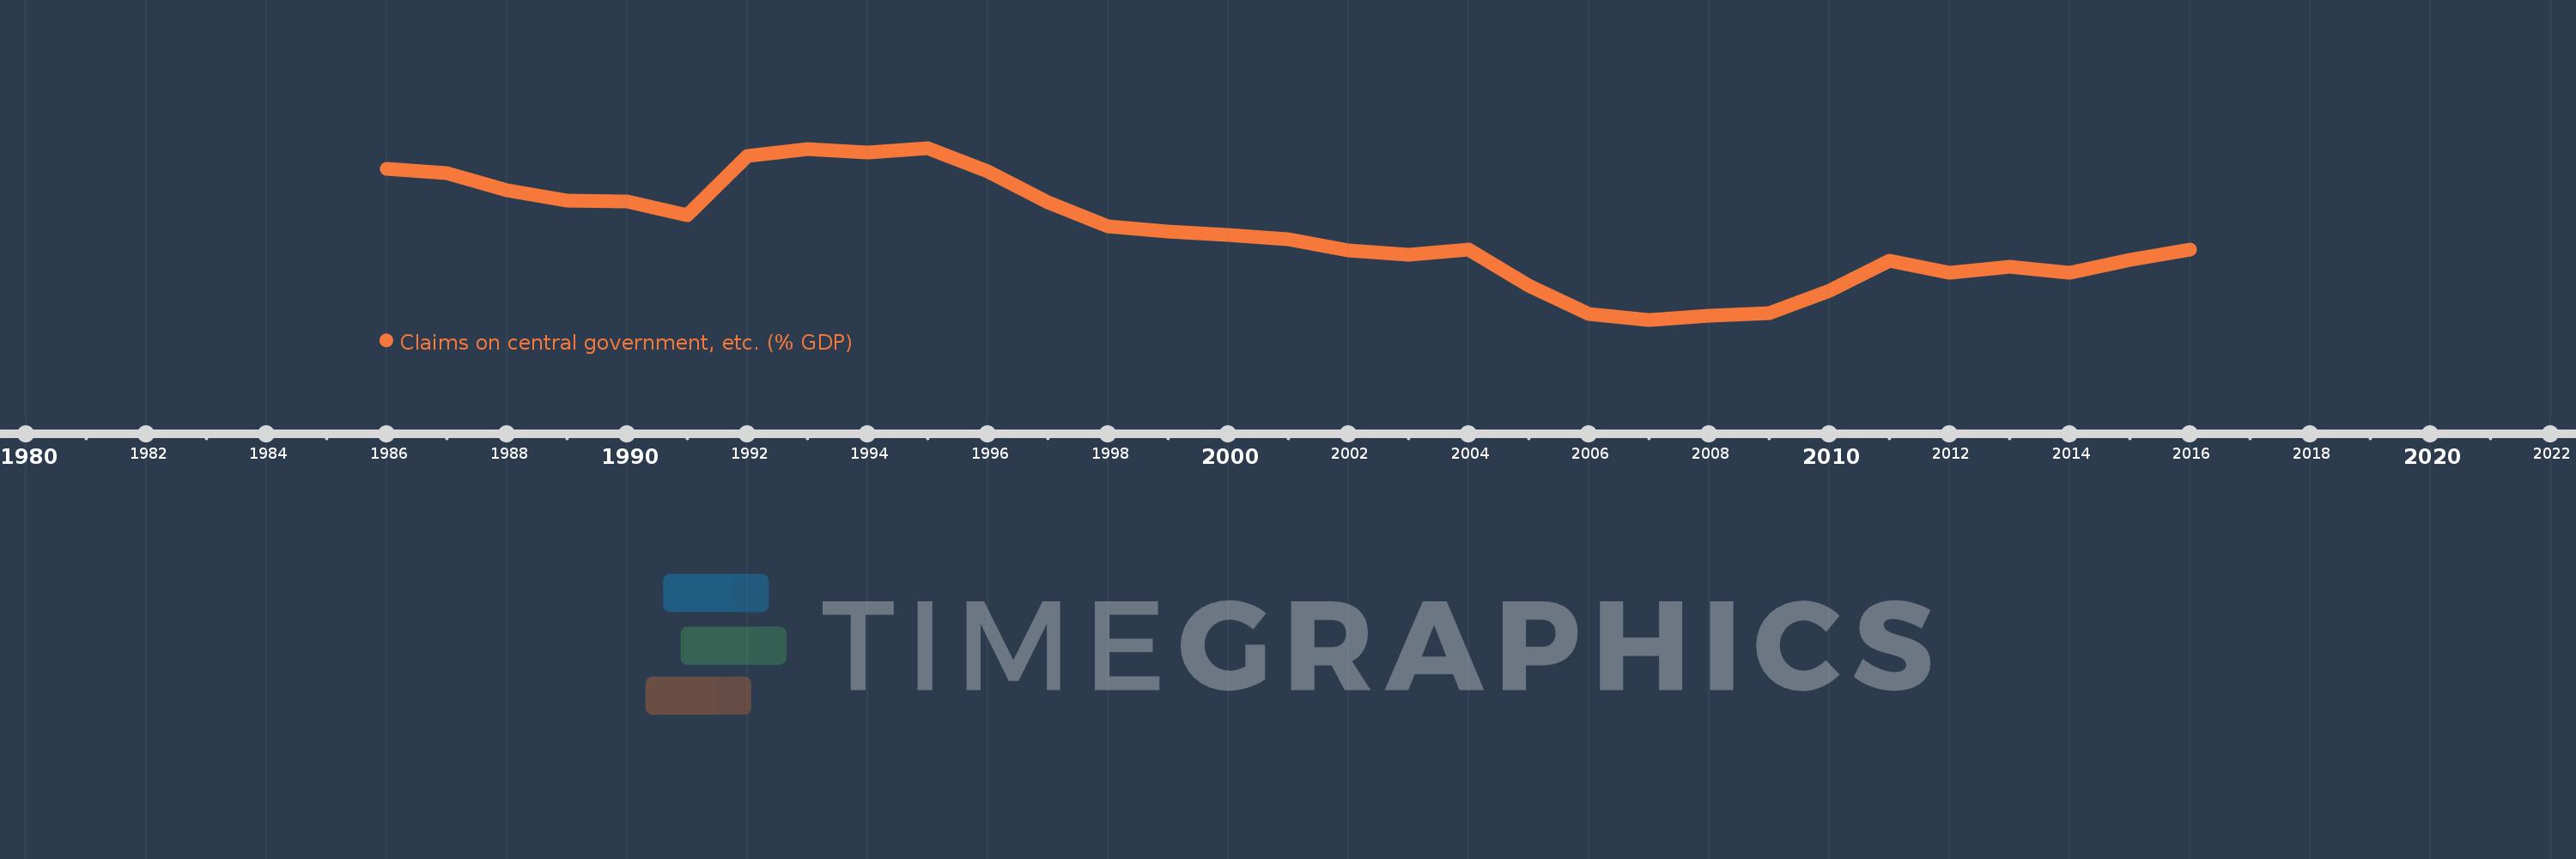
Claims on central government, etc. (% GDP)
2016,2015,2014,2013,2012,2011,2010,2009,2008,2007,2006,2005,2004,2003,2002,2001,2000,1999,1998,1997,1996,1995,1994,1993,1992,1991,1990,1989,1988,1987,1986
This statistics in other country:
AfghanistanAlbaniaAlgeriaAngolaAntigua and BarbudaArab WorldArgentinaArmeniaArubaAustraliaAustriaAzerbaijanBahamas, TheBahrainBangladeshBarbadosBelarusBelgiumBelizeBeninBhutanBoliviaBosnia and HerzegovinaBotswanaBrazilBrunei DarussalamBulgariaBurkina FasoBurundiCabo VerdeCambodiaCameroonCanadaCaribbean small statesCentral African RepublicCentral Europe and the BalticsChadChileChinaColombiaComorosCongo, Dem. Rep.Congo, Rep.Costa RicaCote d'IvoireCroatiaCyprusCzech RepublicDenmarkDjiboutiDominicaDominican RepublicEarly-demographic dividendEast Asia & PacificEast Asia & Pacific (excluding high income)East Asia & Pacific (IDA & IBRD countries)EcuadorEgypt, Arab Rep.El SalvadorEquatorial GuineaEritreaEstoniaEthiopiaEuro areaEurope & Central AsiaEurope & Central Asia (excluding high income)Europe & Central Asia (IDA & IBRD countries)European UnionFijiFinlandFragile and conflict affected situationsFranceGabonGambia, TheGeorgiaGermanyGhanaGreeceGrenadaGuatemalaGuineaGuinea-BissauGuyanaHaitiHeavily indebted poor countries (HIPC)High incomeHondurasHong Kong SAR, ChinaHungaryIBRD onlyIcelandIDA & IBRD totalIDA blendIDA onlyIDA totalIndiaIndonesiaIran, Islamic Rep.IraqIrelandIsraelItalyJamaicaJapanJordanKazakhstanKenyaKorea, Rep.KosovoKuwaitKyrgyz RepublicLao PDRLate-demographic dividendLatin America & Caribbean Latin America & Caribbean (excluding high income)Latin America & the Caribbean (IDA & IBRD countries)LatviaLeast developed countries: UN classificationLebanonLesothoLiberiaLibyaLithuaniaLow & middle incomeLow incomeLower middle incomeLuxembourgMacao SAR, ChinaMacedonia, FYRMadagascarMalawiMalaysiaMaldivesMaliMaltaMauritaniaMauritiusMexicoMicronesia, Fed. Sts.Middle East & North AfricaMiddle East & North Africa (excluding high income)Middle East & North Africa (IDA & IBRD countries)Middle incomeMoldovaMongoliaMontenegroMoroccoMozambiqueMyanmarNamibiaNepalNetherlandsNew ZealandNicaraguaNigerNigeriaNorth AmericaNorwayOECD membersOmanOther small statesPacific island small statesPakistanPanamaPapua New GuineaParaguayPeruPhilippinesPolandPortugalPost-demographic dividendPre-demographic dividendQatarRomaniaRussian FederationRwandaSamoaSao Tome and PrincipeSaudi ArabiaSenegalSerbiaSeychellesSierra LeoneSingaporeSlovak RepublicSloveniaSmall statesSolomon IslandsSouth AfricaSouth AsiaSouth Asia (IDA & IBRD)South SudanSpainSri LankaSt. Kitts and NevisSt. LuciaSt. Vincent and the GrenadinesSub-Saharan Africa Sub-Saharan Africa (excluding high income)Sub-Saharan Africa (IDA & IBRD countries)SudanSurinameSwazilandSwedenSwitzerlandSyrian Arab RepublicTajikistanTanzaniaThailandTimor-LesteTogoTongaTrinidad and TobagoTunisiaTurkeyUgandaUkraineUnited Arab EmiratesUnited KingdomUnited StatesUpper middle incomeUruguayVanuatuVenezuela, RBVietnamWest Bank and GazaWorldYemen, Rep.ZambiaZimbabwe Timeline:
This timeline shows a graph from 1986 to 2016 of Equatorial Guinea. No data until 1985. Number of actual observations by date: 31.
Source name:
World Development Indicators
Source organization:
International Monetary Fund, International Financial Statistics and data files, and World Bank and OECD GDP estimates.
Categories, topics:
Financial Sector
Last updated:
apr 23, 2017
Indicators value changes by year
Minimum:
-25.666
jan 1, 2007
Maximum:
31.362
jan 1, 1995
At the date of observation
Value
Absolute change
Change from previous value
jan 1, 1986
24.41
+24.41
0.0%
jan 1, 1987
23.007
-1.403
-5.75%
jan 1, 1988
17.247
-5.76
-25.04%
jan 1, 1989
13.772
-3.475
-20.15%
jan 1, 1990
13.716
-0.057
-0.41%
jan 1, 1991
8.927
-4.788
-34.91%
jan 1, 1992
28.769
+19.841
222.25%
jan 1, 1993
31.047
+2.278
7.92%
jan 1, 1994
29.93
-1.117
-3.6%
jan 1, 1995
31.362
+1.433
4.79%
jan 1, 1996
23.607
-7.755
-24.73%
jan 1, 1997
13.372
-10.235
-43.36%
jan 1, 1998
5.385
-7.986
-59.72%
jan 1, 1999
3.558
-1.827
-33.92%
jan 1, 2000
2.46
-1.098
-30.87%
jan 1, 2001
1.036
-1.424
-57.89%
jan 1, 2002
-2.617
-3.653
-352.65%
jan 1, 2003
-3.995
-1.378
52.63%
jan 1, 2004
-2.376
+1.619
-40.52%
jan 1, 2005
-14.232
-11.856
498.94%
jan 1, 2006
-23.696
-9.464
66.5%
jan 1, 2007
-25.666
-1.97
8.31%
jan 1, 2008
-24.322
+1.344
-5.24%
jan 1, 2009
-23.418
+0.904
-3.72%
jan 1, 2010
-15.94
+7.478
-31.93%
jan 1, 2011
-6.153
+9.786
-61.4%
jan 1, 2012
-10.154
-4.001
65.02%
jan 1, 2013
-8.179
+1.976
-19.46%
jan 1, 2014
-10.181
-2.002
24.48%
jan 1, 2015
-5.829
+4.351
-42.74%
jan 1, 2016
-2.434
+3.396
-58.25%
Ranking of countries by current statistics by years


Comments: