29
/
en
AIzaSyAYiBZKx7MnpbEhh9jyipgxe19OcubqV5w
April 1, 2024
62432
World
WLD
false
2
1
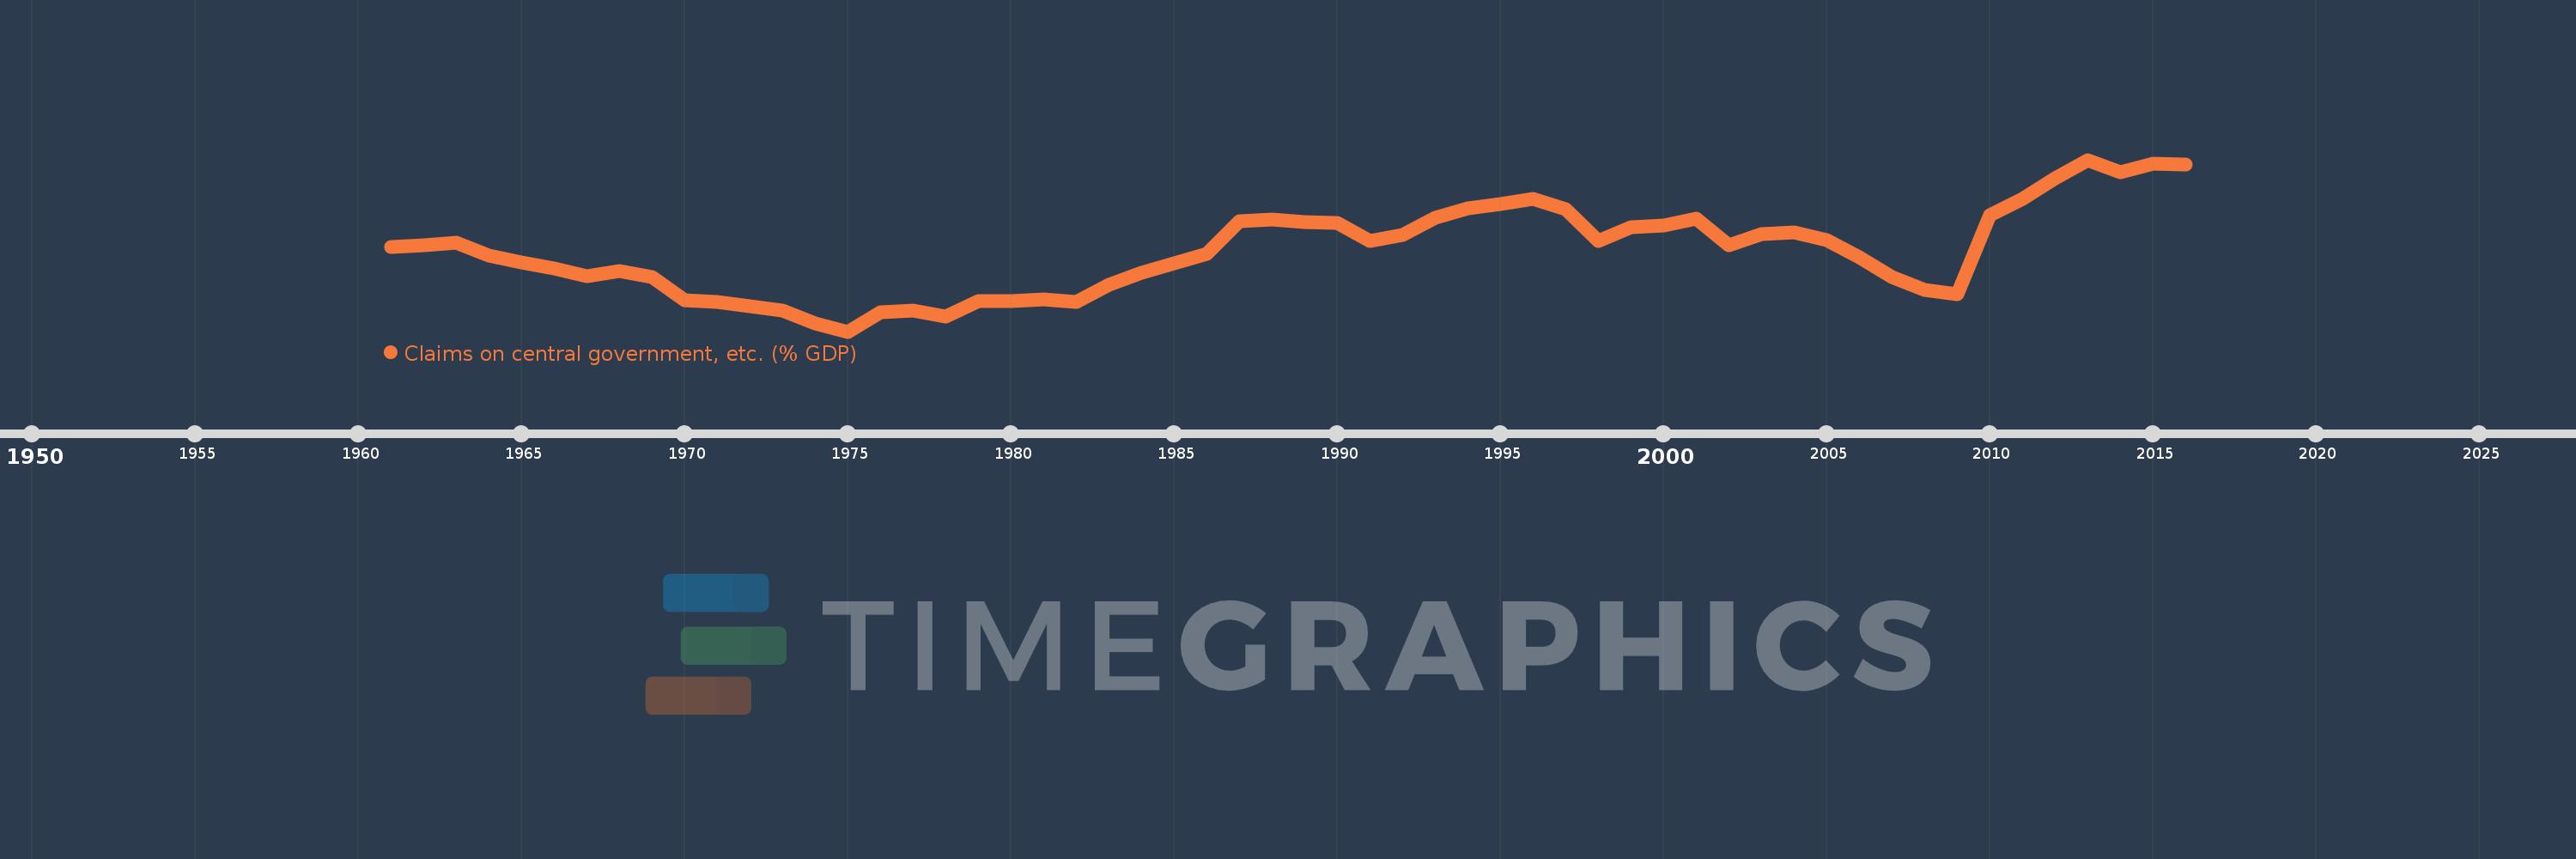
Claims on central government, etc. (% GDP)
2016,2015,2014,2013,2012,2011,2010,2009,2008,2007,2006,2005,2004,2003,2002,2001,2000,1999,1998,1997,1996,1995,1994,1993,1992,1991,1990,1989,1988,1987,1986,1985,1984,1983,1982,1981,1980,1979,1978,1977,1976,1975,1974,1973,1972,1971,1970,1969,1968,1967,1966,1965,1964,1963,1962,1961
This statistics in other country:
AfghanistanAlbaniaAlgeriaAngolaAntigua and BarbudaArab WorldArgentinaArmeniaArubaAustraliaAustriaAzerbaijanBahamas, TheBahrainBangladeshBarbadosBelarusBelgiumBelizeBeninBhutanBoliviaBosnia and HerzegovinaBotswanaBrazilBrunei DarussalamBulgariaBurkina FasoBurundiCabo VerdeCambodiaCameroonCanadaCaribbean small statesCentral African RepublicCentral Europe and the BalticsChadChileChinaColombiaComorosCongo, Dem. Rep.Congo, Rep.Costa RicaCote d'IvoireCroatiaCyprusCzech RepublicDenmarkDjiboutiDominicaDominican RepublicEarly-demographic dividendEast Asia & PacificEast Asia & Pacific (excluding high income)East Asia & Pacific (IDA & IBRD countries)EcuadorEgypt, Arab Rep.El SalvadorEquatorial GuineaEritreaEstoniaEthiopiaEuro areaEurope & Central AsiaEurope & Central Asia (excluding high income)Europe & Central Asia (IDA & IBRD countries)European UnionFijiFinlandFragile and conflict affected situationsFranceGabonGambia, TheGeorgiaGermanyGhanaGreeceGrenadaGuatemalaGuineaGuinea-BissauGuyanaHaitiHeavily indebted poor countries (HIPC)High incomeHondurasHong Kong SAR, ChinaHungaryIBRD onlyIcelandIDA & IBRD totalIDA blendIDA onlyIDA totalIndiaIndonesiaIran, Islamic Rep.IraqIrelandIsraelItalyJamaicaJapanJordanKazakhstanKenyaKorea, Rep.KosovoKuwaitKyrgyz RepublicLao PDRLate-demographic dividendLatin America & Caribbean Latin America & Caribbean (excluding high income)Latin America & the Caribbean (IDA & IBRD countries)LatviaLeast developed countries: UN classificationLebanonLesothoLiberiaLibyaLithuaniaLow & middle incomeLow incomeLower middle incomeLuxembourgMacao SAR, ChinaMacedonia, FYRMadagascarMalawiMalaysiaMaldivesMaliMaltaMauritaniaMauritiusMexicoMicronesia, Fed. Sts.Middle East & North AfricaMiddle East & North Africa (excluding high income)Middle East & North Africa (IDA & IBRD countries)Middle incomeMoldovaMongoliaMontenegroMoroccoMozambiqueMyanmarNamibiaNepalNetherlandsNew ZealandNicaraguaNigerNigeriaNorth AmericaNorwayOECD membersOmanOther small statesPacific island small statesPakistanPanamaPapua New GuineaParaguayPeruPhilippinesPolandPortugalPost-demographic dividendPre-demographic dividendQatarRomaniaRussian FederationRwandaSamoaSao Tome and PrincipeSaudi ArabiaSenegalSerbiaSeychellesSierra LeoneSingaporeSlovak RepublicSloveniaSmall statesSolomon IslandsSouth AfricaSouth AsiaSouth Asia (IDA & IBRD)South SudanSpainSri LankaSt. Kitts and NevisSt. LuciaSt. Vincent and the GrenadinesSub-Saharan Africa Sub-Saharan Africa (excluding high income)Sub-Saharan Africa (IDA & IBRD countries)SudanSurinameSwazilandSwedenSwitzerlandSyrian Arab RepublicTajikistanTanzaniaThailandTimor-LesteTogoTongaTrinidad and TobagoTunisiaTurkeyUgandaUkraineUnited Arab EmiratesUnited KingdomUnited StatesUpper middle incomeUruguayVanuatuVenezuela, RBVietnamWest Bank and GazaWorldYemen, Rep.ZambiaZimbabwe Timeline:
This timeline shows a graph from 1961 to 2016 of World. No data until 1960. Number of actual observations by date: 56.
Source name:
World Development Indicators
Source organization:
International Monetary Fund, International Financial Statistics and data files, and World Bank and OECD GDP estimates.
Categories, topics:
Financial Sector
Last updated:
apr 23, 2017
Indicators value changes by year
Minimum:
10.701
jan 1, 1975
Maximum:
27.078
jan 1, 2013
At the date of observation
Value
Absolute change
Change from previous value
jan 1, 1961
18.729
+18.729
0.0%
jan 1, 1962
18.915
+0.187
1.0%
jan 1, 1963
19.15
+0.235
1.24%
jan 1, 1964
17.962
-1.188
-6.2%
jan 1, 1965
17.287
-0.675
-3.76%
jan 1, 1966
16.702
-0.585
-3.38%
jan 1, 1967
15.972
-0.73
-4.37%
jan 1, 1968
16.488
+0.516
3.23%
jan 1, 1969
15.937
-0.552
-3.35%
jan 1, 1970
13.682
-2.255
-14.15%
jan 1, 1971
13.502
-0.179
-1.31%
jan 1, 1972
13.089
-0.413
-3.06%
jan 1, 1973
12.667
-0.422
-3.23%
jan 1, 1974
11.46
-1.207
-9.53%
jan 1, 1975
10.701
-0.759
-6.62%
jan 1, 1976
12.582
+1.881
17.58%
jan 1, 1977
12.674
+0.092
0.73%
jan 1, 1978
12.152
-0.522
-4.12%
jan 1, 1979
13.61
+1.458
12.0%
jan 1, 1980
13.609
-0.001
-0.01%
jan 1, 1981
13.738
+0.129
0.95%
jan 1, 1982
13.524
-0.214
-1.55%
jan 1, 1983
15.125
+1.601
11.84%
jan 1, 1984
16.323
+1.197
7.92%
jan 1, 1985
17.248
+0.925
5.67%
jan 1, 1986
18.144
+0.896
5.2%
jan 1, 1987
21.192
+3.048
16.8%
jan 1, 1988
21.419
+0.227
1.07%
jan 1, 1989
21.135
-0.283
-1.32%
jan 1, 1990
21.07
-0.065
-0.31%
jan 1, 1991
19.333
-1.737
-8.24%
jan 1, 1992
19.925
+0.592
3.06%
jan 1, 1993
21.567
+1.642
8.24%
jan 1, 1994
22.452
+0.885
4.11%
jan 1, 1995
22.85
+0.398
1.77%
jan 1, 1996
23.367
+0.517
2.26%
jan 1, 1997
22.392
-0.975
-4.17%
jan 1, 1998
19.337
-3.055
-13.64%
jan 1, 1999
20.659
+1.323
6.84%
jan 1, 2000
20.782
+0.122
0.59%
jan 1, 2001
21.432
+0.65
3.13%
jan 1, 2002
18.904
-2.528
-11.8%
jan 1, 2003
19.955
+1.051
5.56%
jan 1, 2004
20.199
+0.245
1.23%
jan 1, 2005
19.408
-0.791
-3.92%
jan 1, 2006
17.781
-1.627
-8.38%
jan 1, 2007
15.895
-1.886
-10.61%
jan 1, 2008
14.643
-1.252
-7.88%
jan 1, 2009
14.242
-0.402
-2.74%
jan 1, 2010
21.78
+7.539
52.93%
jan 1, 2011
23.316
+1.535
7.05%
jan 1, 2012
25.35
+2.035
8.73%
jan 1, 2013
27.078
+1.727
6.81%
jan 1, 2014
25.888
-1.19
-4.39%
jan 1, 2015
26.703
+0.815
3.15%
jan 1, 2016
26.638
-0.065
-0.25%
Ranking of countries by current statistics by years


Comments: