29
/
en
AIzaSyAYiBZKx7MnpbEhh9jyipgxe19OcubqV5w
April 1, 2024
28921
East Asia & Pacific (IDA & IBRD countries)
TEA
false
2
1
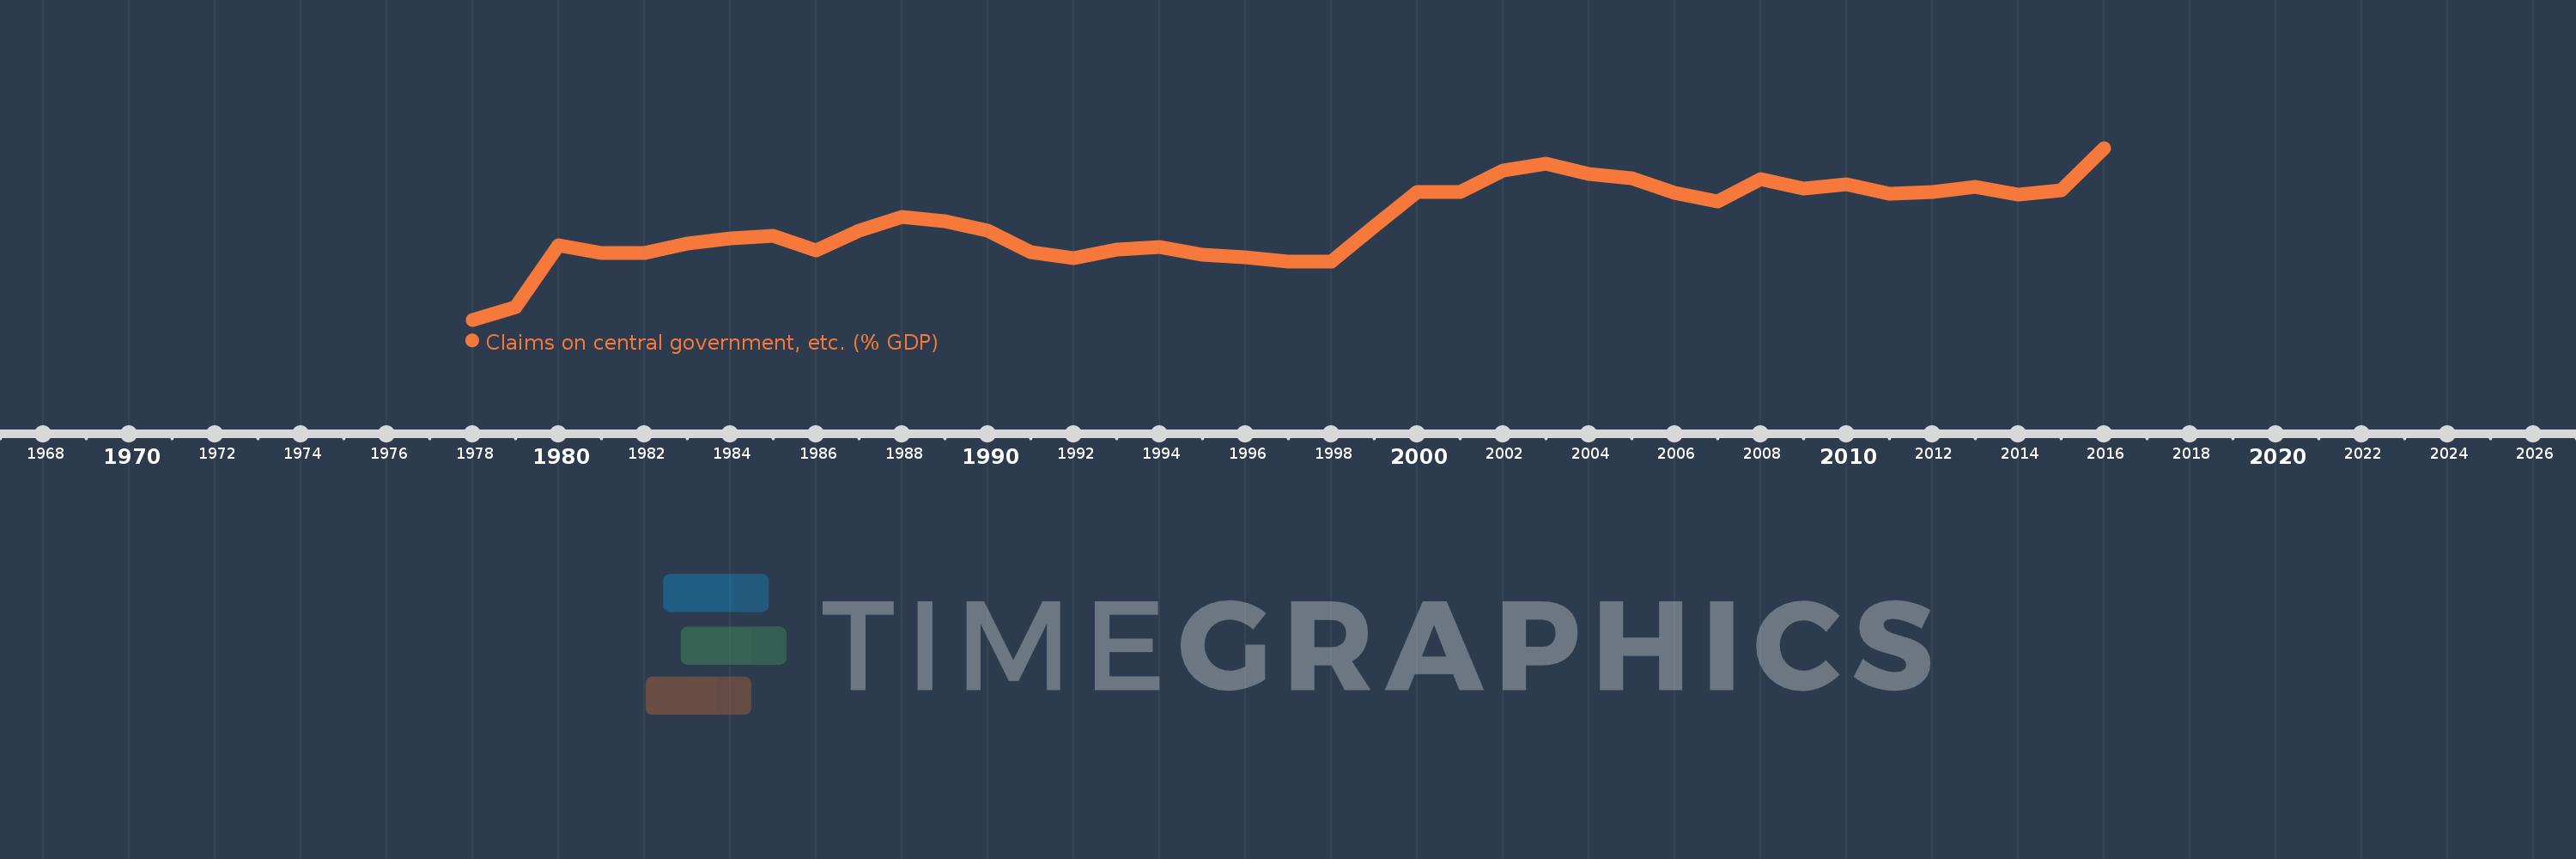
Claims on central government, etc. (% GDP)
2016,2015,2014,2013,2012,2011,2010,2009,2008,2007,2006,2005,2004,2003,2002,2001,2000,1999,1998,1997,1996,1995,1994,1993,1992,1991,1990,1989,1988,1987,1986,1985,1984,1983,1982,1981,1980,1979,1978
This statistics in other country:
AfghanistanAlbaniaAlgeriaAngolaAntigua and BarbudaArab WorldArgentinaArmeniaArubaAustraliaAustriaAzerbaijanBahamas, TheBahrainBangladeshBarbadosBelarusBelgiumBelizeBeninBhutanBoliviaBosnia and HerzegovinaBotswanaBrazilBrunei DarussalamBulgariaBurkina FasoBurundiCabo VerdeCambodiaCameroonCanadaCaribbean small statesCentral African RepublicCentral Europe and the BalticsChadChileChinaColombiaComorosCongo, Dem. Rep.Congo, Rep.Costa RicaCote d'IvoireCroatiaCyprusCzech RepublicDenmarkDjiboutiDominicaDominican RepublicEarly-demographic dividendEast Asia & PacificEast Asia & Pacific (excluding high income)East Asia & Pacific (IDA & IBRD countries)EcuadorEgypt, Arab Rep.El SalvadorEquatorial GuineaEritreaEstoniaEthiopiaEuro areaEurope & Central AsiaEurope & Central Asia (excluding high income)Europe & Central Asia (IDA & IBRD countries)European UnionFijiFinlandFragile and conflict affected situationsFranceGabonGambia, TheGeorgiaGermanyGhanaGreeceGrenadaGuatemalaGuineaGuinea-BissauGuyanaHaitiHeavily indebted poor countries (HIPC)High incomeHondurasHong Kong SAR, ChinaHungaryIBRD onlyIcelandIDA & IBRD totalIDA blendIDA onlyIDA totalIndiaIndonesiaIran, Islamic Rep.IraqIrelandIsraelItalyJamaicaJapanJordanKazakhstanKenyaKorea, Rep.KosovoKuwaitKyrgyz RepublicLao PDRLate-demographic dividendLatin America & Caribbean Latin America & Caribbean (excluding high income)Latin America & the Caribbean (IDA & IBRD countries)LatviaLeast developed countries: UN classificationLebanonLesothoLiberiaLibyaLithuaniaLow & middle incomeLow incomeLower middle incomeLuxembourgMacao SAR, ChinaMacedonia, FYRMadagascarMalawiMalaysiaMaldivesMaliMaltaMauritaniaMauritiusMexicoMicronesia, Fed. Sts.Middle East & North AfricaMiddle East & North Africa (excluding high income)Middle East & North Africa (IDA & IBRD countries)Middle incomeMoldovaMongoliaMontenegroMoroccoMozambiqueMyanmarNamibiaNepalNetherlandsNew ZealandNicaraguaNigerNigeriaNorth AmericaNorwayOECD membersOmanOther small statesPacific island small statesPakistanPanamaPapua New GuineaParaguayPeruPhilippinesPolandPortugalPost-demographic dividendPre-demographic dividendQatarRomaniaRussian FederationRwandaSamoaSao Tome and PrincipeSaudi ArabiaSenegalSerbiaSeychellesSierra LeoneSingaporeSlovak RepublicSloveniaSmall statesSolomon IslandsSouth AfricaSouth AsiaSouth Asia (IDA & IBRD)South SudanSpainSri LankaSt. Kitts and NevisSt. LuciaSt. Vincent and the GrenadinesSub-Saharan Africa Sub-Saharan Africa (excluding high income)Sub-Saharan Africa (IDA & IBRD countries)SudanSurinameSwazilandSwedenSwitzerlandSyrian Arab RepublicTajikistanTanzaniaThailandTimor-LesteTogoTongaTrinidad and TobagoTunisiaTurkeyUgandaUkraineUnited Arab EmiratesUnited KingdomUnited StatesUpper middle incomeUruguayVanuatuVenezuela, RBVietnamWest Bank and GazaWorldYemen, Rep.ZambiaZimbabwe Timeline:
This timeline shows a graph from 1978 to 2016 of East Asia & Pacific (IDA & IBRD countries). No data until 1977. Number of actual observations by date: 39.
Source name:
World Development Indicators
Source organization:
International Monetary Fund, International Financial Statistics and data files, and World Bank and OECD GDP estimates.
Categories, topics:
Financial Sector
Last updated:
apr 23, 2017
Indicators value changes by year
Minimum:
-6.627
jan 1, 1978
Maximum:
13.603
jan 1, 2016
At the date of observation
Value
Absolute change
Change from previous value
jan 1, 1978
-6.627
-6.627
0.0%
jan 1, 1979
-5.104
+1.523
-22.98%
jan 1, 1980
2.157
+7.26
-142.26%
jan 1, 1981
1.196
-0.96
-44.53%
jan 1, 1982
1.257
+0.061
5.09%
jan 1, 1983
2.327
+1.07
85.12%
jan 1, 1984
2.99
+0.663
28.5%
jan 1, 1985
3.282
+0.291
9.74%
jan 1, 1986
1.543
-1.738
-52.97%
jan 1, 1987
3.812
+2.269
146.98%
jan 1, 1988
5.529
+1.717
45.05%
jan 1, 1989
4.982
-0.547
-9.89%
jan 1, 1990
3.848
-1.134
-22.76%
jan 1, 1991
1.29
-2.558
-66.48%
jan 1, 1992
0.598
-0.692
-53.64%
jan 1, 1993
1.656
+1.058
176.91%
jan 1, 1994
1.959
+0.303
18.29%
jan 1, 1995
1.012
-0.947
-48.33%
jan 1, 1996
0.685
-0.327
-32.35%
jan 1, 1997
0.203
-0.482
-70.36%
jan 1, 1998
0.252
+0.049
24.25%
jan 1, 1999
4.382
+4.13
1.64K%
jan 1, 2000
8.443
+4.061
92.67%
jan 1, 2001
8.364
-0.079
-0.94%
jan 1, 2002
10.983
+2.62
31.32%
jan 1, 2003
11.736
+0.753
6.85%
jan 1, 2004
10.517
-1.219
-10.38%
jan 1, 2005
10.038
-0.479
-4.55%
jan 1, 2006
8.358
-1.68
-16.74%
jan 1, 2007
7.274
-1.083
-12.96%
jan 1, 2008
9.937
+2.663
36.61%
jan 1, 2009
8.82
-1.117
-11.24%
jan 1, 2010
9.288
+0.468
5.31%
jan 1, 2011
8.226
-1.062
-11.44%
jan 1, 2012
8.44
+0.214
2.6%
jan 1, 2013
8.983
+0.543
6.44%
jan 1, 2014
8.144
-0.839
-9.34%
jan 1, 2015
8.595
+0.451
5.54%
jan 1, 2016
13.603
+5.008
58.27%
Ranking of countries by current statistics by years


Comments: