29
/
en
AIzaSyAYiBZKx7MnpbEhh9jyipgxe19OcubqV5w
April 1, 2024
209122
New Zealand
NZL
true
2
1
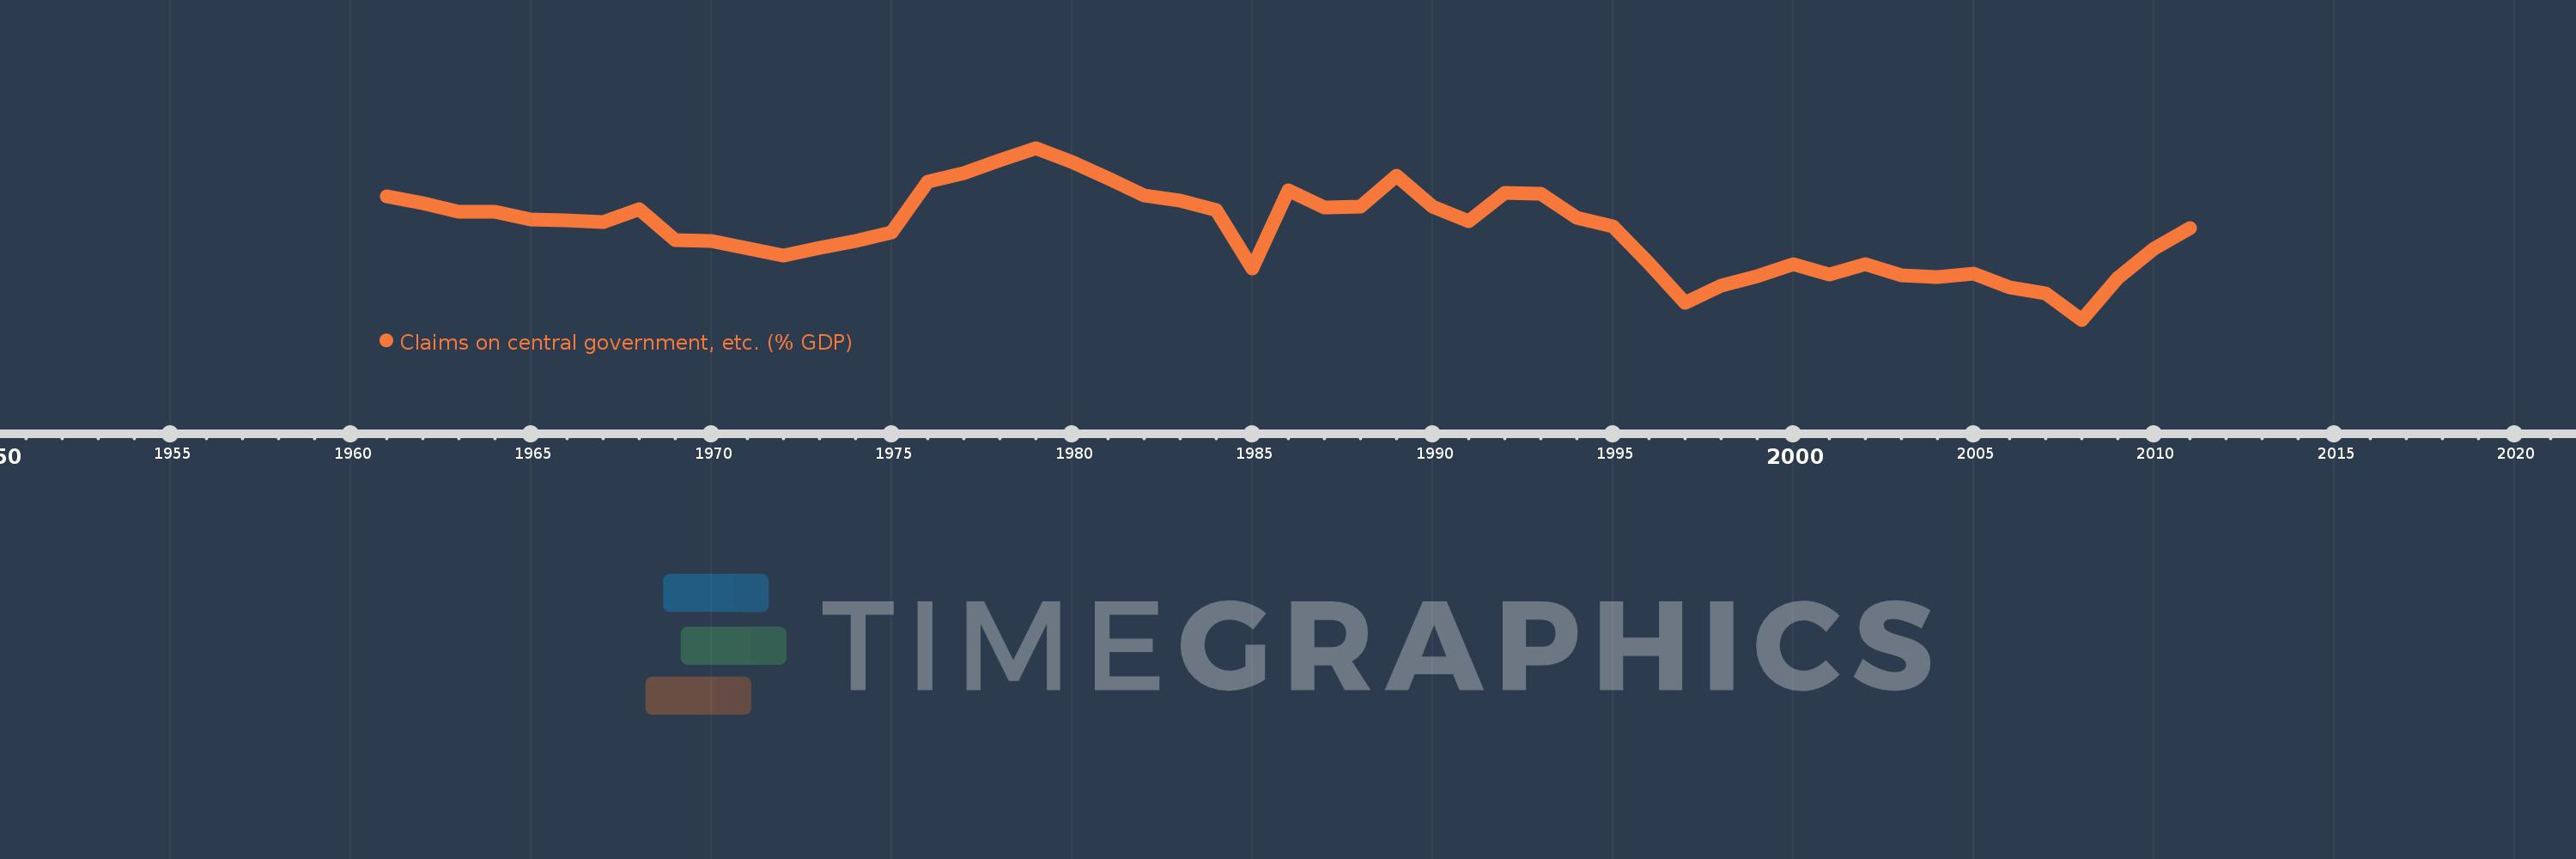
Claims on central government, etc. (% GDP)
2011,2010,2009,2008,2007,2006,2005,2004,2003,2002,2001,2000,1999,1998,1997,1996,1995,1994,1993,1992,1991,1990,1989,1988,1987,1986,1985,1984,1983,1982,1981,1980,1979,1978,1977,1976,1975,1974,1973,1972,1970,1969,1968,1967,1966,1965,1964,1963,1962,1961
This statistics in other country:
AfghanistanAlbaniaAlgeriaAngolaAntigua and BarbudaArab WorldArgentinaArmeniaArubaAustraliaAustriaAzerbaijanBahamas, TheBahrainBangladeshBarbadosBelarusBelgiumBelizeBeninBhutanBoliviaBosnia and HerzegovinaBotswanaBrazilBrunei DarussalamBulgariaBurkina FasoBurundiCabo VerdeCambodiaCameroonCanadaCaribbean small statesCentral African RepublicCentral Europe and the BalticsChadChileChinaColombiaComorosCongo, Dem. Rep.Congo, Rep.Costa RicaCote d'IvoireCroatiaCyprusCzech RepublicDenmarkDjiboutiDominicaDominican RepublicEarly-demographic dividendEast Asia & PacificEast Asia & Pacific (excluding high income)East Asia & Pacific (IDA & IBRD countries)EcuadorEgypt, Arab Rep.El SalvadorEquatorial GuineaEritreaEstoniaEthiopiaEuro areaEurope & Central AsiaEurope & Central Asia (excluding high income)Europe & Central Asia (IDA & IBRD countries)European UnionFijiFinlandFragile and conflict affected situationsFranceGabonGambia, TheGeorgiaGermanyGhanaGreeceGrenadaGuatemalaGuineaGuinea-BissauGuyanaHaitiHeavily indebted poor countries (HIPC)High incomeHondurasHong Kong SAR, ChinaHungaryIBRD onlyIcelandIDA & IBRD totalIDA blendIDA onlyIDA totalIndiaIndonesiaIran, Islamic Rep.IraqIrelandIsraelItalyJamaicaJapanJordanKazakhstanKenyaKorea, Rep.KosovoKuwaitKyrgyz RepublicLao PDRLate-demographic dividendLatin America & Caribbean Latin America & Caribbean (excluding high income)Latin America & the Caribbean (IDA & IBRD countries)LatviaLeast developed countries: UN classificationLebanonLesothoLiberiaLibyaLithuaniaLow & middle incomeLow incomeLower middle incomeLuxembourgMacao SAR, ChinaMacedonia, FYRMadagascarMalawiMalaysiaMaldivesMaliMaltaMauritaniaMauritiusMexicoMicronesia, Fed. Sts.Middle East & North AfricaMiddle East & North Africa (excluding high income)Middle East & North Africa (IDA & IBRD countries)Middle incomeMoldovaMongoliaMontenegroMoroccoMozambiqueMyanmarNamibiaNepalNetherlandsNew ZealandNicaraguaNigerNigeriaNorth AmericaNorwayOECD membersOmanOther small statesPacific island small statesPakistanPanamaPapua New GuineaParaguayPeruPhilippinesPolandPortugalPost-demographic dividendPre-demographic dividendQatarRomaniaRussian FederationRwandaSamoaSao Tome and PrincipeSaudi ArabiaSenegalSerbiaSeychellesSierra LeoneSingaporeSlovak RepublicSloveniaSmall statesSolomon IslandsSouth AfricaSouth AsiaSouth Asia (IDA & IBRD)South SudanSpainSri LankaSt. Kitts and NevisSt. LuciaSt. Vincent and the GrenadinesSub-Saharan Africa Sub-Saharan Africa (excluding high income)Sub-Saharan Africa (IDA & IBRD countries)SudanSurinameSwazilandSwedenSwitzerlandSyrian Arab RepublicTajikistanTanzaniaThailandTimor-LesteTogoTongaTrinidad and TobagoTunisiaTurkeyUgandaUkraineUnited Arab EmiratesUnited KingdomUnited StatesUpper middle incomeUruguayVanuatuVenezuela, RBVietnamWest Bank and GazaWorldYemen, Rep.ZambiaZimbabwe Timeline:
This timeline shows a graph from 1961 to 2011 of New Zealand. No data until 1960. Number of actual observations by date: 50.
Source name:
World Development Indicators
Source organization:
International Monetary Fund, International Financial Statistics and data files, and World Bank and OECD GDP estimates.
Categories, topics:
Financial Sector
Last updated:
apr 23, 2017
Indicators value changes by year
Minimum:
-3.655
jan 1, 2008
At the date of observation
Value
Absolute change
Change from previous value
jan 1, 1961
6.504
+6.504
0.0%
jan 1, 1962
5.957
-0.548
-8.42%
jan 1, 1963
5.204
-0.752
-12.63%
jan 1, 1964
5.204
0.0
-0.01%
jan 1, 1965
4.579
-0.625
-12.0%
jan 1, 1966
4.518
-0.061
-1.34%
jan 1, 1967
4.407
-0.111
-2.46%
jan 1, 1968
5.424
+1.017
23.08%
jan 1, 1969
2.915
-2.509
-46.26%
jan 1, 1970
2.827
-0.087
-3.0%
jan 1, 1972
1.635
-1.192
-42.16%
jan 1, 1973
2.264
+0.628
38.42%
jan 1, 1974
2.836
+0.572
25.28%
jan 1, 1975
3.505
+0.669
23.58%
jan 1, 1976
7.73
+4.225
120.56%
jan 1, 1977
8.422
+0.692
8.95%
jan 1, 1978
9.459
+1.036
12.31%
jan 1, 1979
10.48
+1.021
10.79%
jan 1, 1980
9.32
-1.16
-11.07%
jan 1, 1981
7.988
-1.332
-14.29%
jan 1, 1982
6.559
-1.429
-17.89%
jan 1, 1983
6.129
-0.43
-6.55%
jan 1, 1984
5.402
-0.726
-11.85%
jan 1, 1985
0.576
-4.826
-89.34%
jan 1, 1986
6.978
+6.401
1.11K%
jan 1, 1987
5.562
-1.415
-20.28%
jan 1, 1988
5.647
+0.085
1.52%
jan 1, 1989
8.176
+2.529
44.78%
jan 1, 1990
5.639
-2.536
-31.02%
jan 1, 1991
4.424
-1.216
-21.55%
jan 1, 1992
6.771
+2.347
53.06%
jan 1, 1993
6.742
-0.029
-0.44%
jan 1, 1994
4.738
-2.003
-29.71%
jan 1, 1995
3.998
-0.741
-15.64%
jan 1, 1996
1.015
-2.983
-74.62%
jan 1, 1997
-2.261
-3.275
-322.83%
jan 1, 1998
-0.862
+1.399
-61.87%
jan 1, 1999
-0.095
+0.767
-89.04%
jan 1, 2000
0.884
+0.978
-1.04K%
jan 1, 2001
0.086
-0.798
-90.31%
jan 1, 2002
0.951
+0.865
1.01K%
jan 1, 2003
-0.018
-0.969
-101.91%
jan 1, 2004
-0.152
-0.134
737.32%
jan 1, 2005
0.139
+0.291
-191.41%
jan 1, 2006
-0.978
-1.117
-803.49%
jan 1, 2007
-1.458
-0.48
49.12%
jan 1, 2008
-3.655
-2.196
150.62%
jan 1, 2009
-0.205
+3.45
-94.4%
jan 1, 2010
2.204
+2.408
-1.18K%
jan 1, 2011
3.896
+1.693
76.82%
Ranking of countries by current statistics by years


Comments: