29
/
en
AIzaSyAYiBZKx7MnpbEhh9jyipgxe19OcubqV5w
April 1, 2024
141599
Greece
GRC
true
2
1
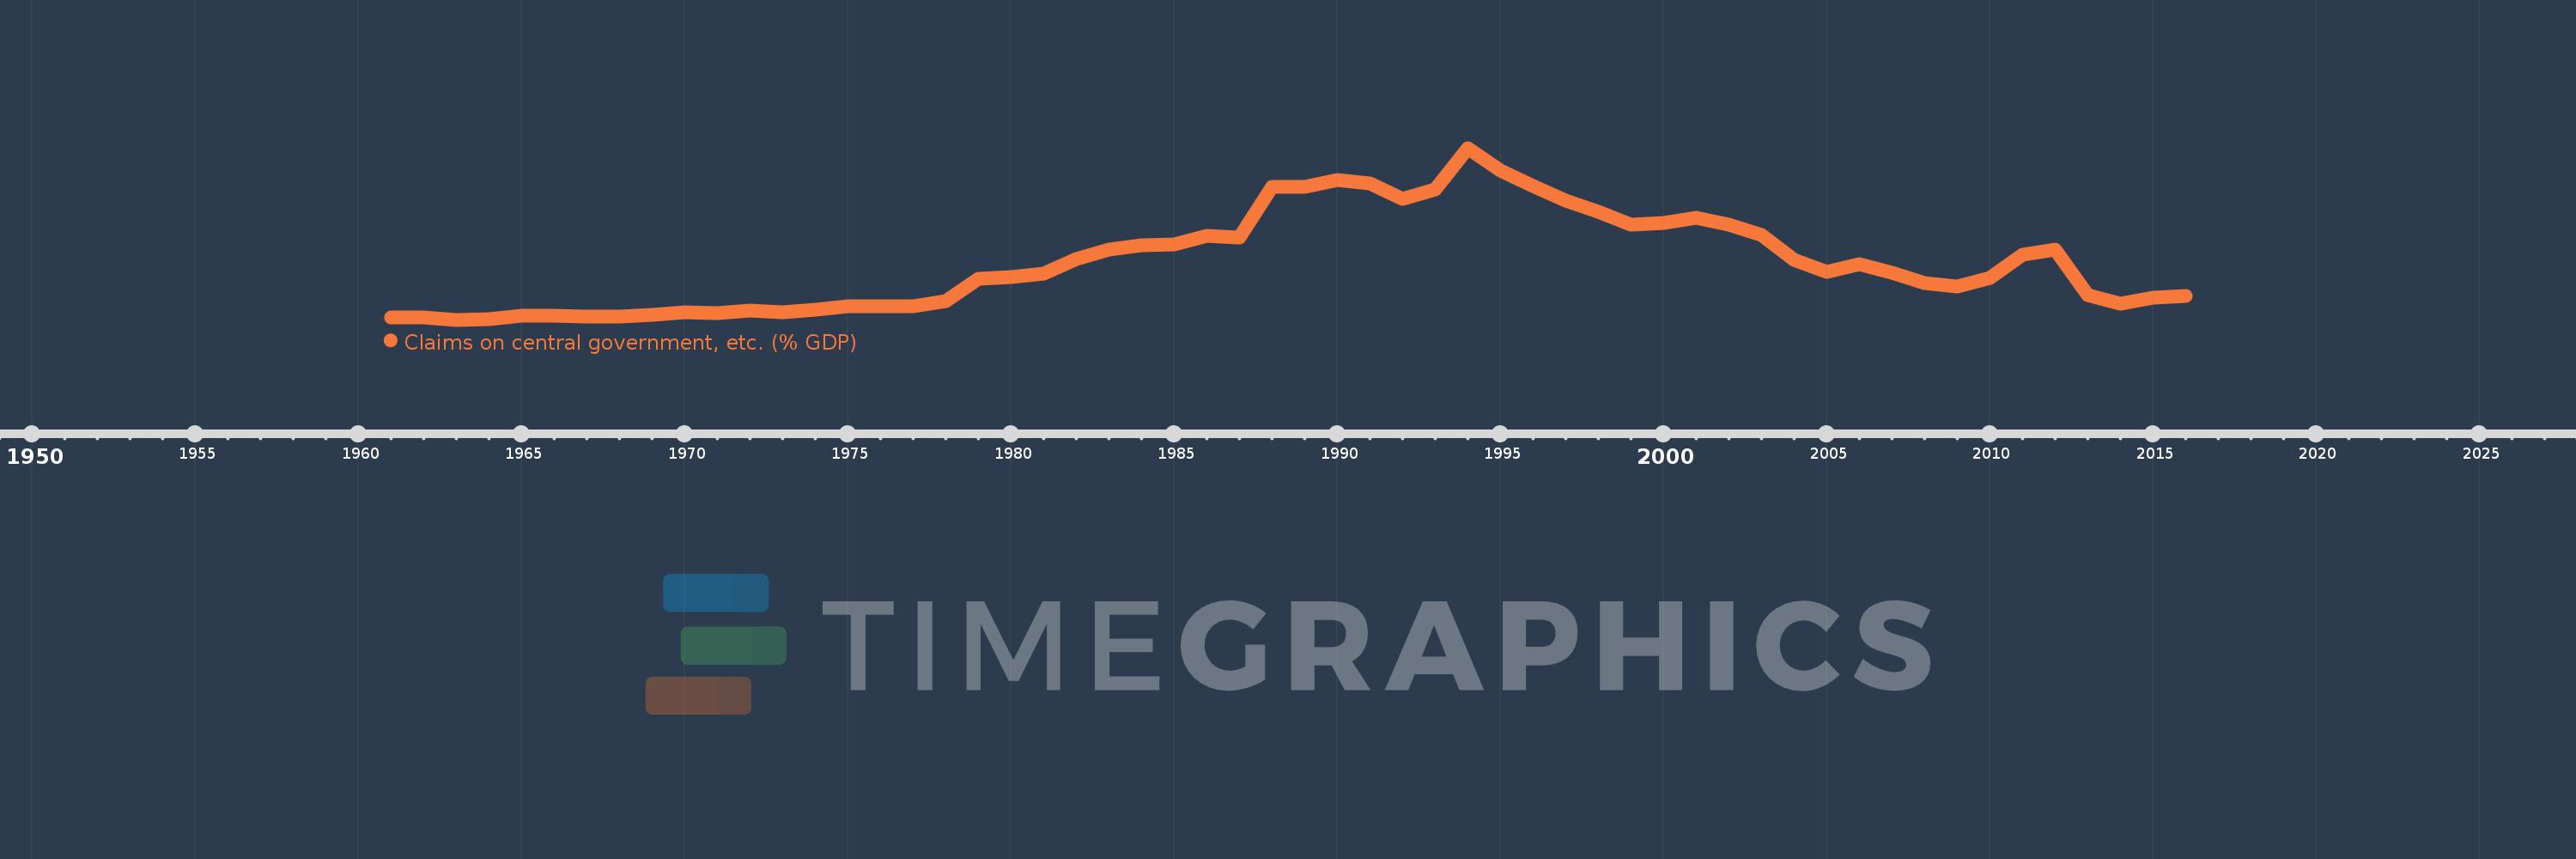
Claims on central government, etc. (% GDP)
2016,2015,2014,2013,2012,2011,2010,2009,2008,2007,2006,2005,2004,2003,2002,2001,2000,1999,1998,1997,1996,1995,1994,1993,1992,1991,1990,1989,1988,1987,1986,1985,1984,1983,1982,1981,1980,1979,1978,1977,1976,1975,1974,1973,1972,1971,1970,1969,1968,1967,1966,1965,1964,1963,1962,1961
This statistics in other country:
AfghanistanAlbaniaAlgeriaAngolaAntigua and BarbudaArab WorldArgentinaArmeniaArubaAustraliaAustriaAzerbaijanBahamas, TheBahrainBangladeshBarbadosBelarusBelgiumBelizeBeninBhutanBoliviaBosnia and HerzegovinaBotswanaBrazilBrunei DarussalamBulgariaBurkina FasoBurundiCabo VerdeCambodiaCameroonCanadaCaribbean small statesCentral African RepublicCentral Europe and the BalticsChadChileChinaColombiaComorosCongo, Dem. Rep.Congo, Rep.Costa RicaCote d'IvoireCroatiaCyprusCzech RepublicDenmarkDjiboutiDominicaDominican RepublicEarly-demographic dividendEast Asia & PacificEast Asia & Pacific (excluding high income)East Asia & Pacific (IDA & IBRD countries)EcuadorEgypt, Arab Rep.El SalvadorEquatorial GuineaEritreaEstoniaEthiopiaEuro areaEurope & Central AsiaEurope & Central Asia (excluding high income)Europe & Central Asia (IDA & IBRD countries)European UnionFijiFinlandFragile and conflict affected situationsFranceGabonGambia, TheGeorgiaGermanyGhanaGreeceGrenadaGuatemalaGuineaGuinea-BissauGuyanaHaitiHeavily indebted poor countries (HIPC)High incomeHondurasHong Kong SAR, ChinaHungaryIBRD onlyIcelandIDA & IBRD totalIDA blendIDA onlyIDA totalIndiaIndonesiaIran, Islamic Rep.IraqIrelandIsraelItalyJamaicaJapanJordanKazakhstanKenyaKorea, Rep.KosovoKuwaitKyrgyz RepublicLao PDRLate-demographic dividendLatin America & Caribbean Latin America & Caribbean (excluding high income)Latin America & the Caribbean (IDA & IBRD countries)LatviaLeast developed countries: UN classificationLebanonLesothoLiberiaLibyaLithuaniaLow & middle incomeLow incomeLower middle incomeLuxembourgMacao SAR, ChinaMacedonia, FYRMadagascarMalawiMalaysiaMaldivesMaliMaltaMauritaniaMauritiusMexicoMicronesia, Fed. Sts.Middle East & North AfricaMiddle East & North Africa (excluding high income)Middle East & North Africa (IDA & IBRD countries)Middle incomeMoldovaMongoliaMontenegroMoroccoMozambiqueMyanmarNamibiaNepalNetherlandsNew ZealandNicaraguaNigerNigeriaNorth AmericaNorwayOECD membersOmanOther small statesPacific island small statesPakistanPanamaPapua New GuineaParaguayPeruPhilippinesPolandPortugalPost-demographic dividendPre-demographic dividendQatarRomaniaRussian FederationRwandaSamoaSao Tome and PrincipeSaudi ArabiaSenegalSerbiaSeychellesSierra LeoneSingaporeSlovak RepublicSloveniaSmall statesSolomon IslandsSouth AfricaSouth AsiaSouth Asia (IDA & IBRD)South SudanSpainSri LankaSt. Kitts and NevisSt. LuciaSt. Vincent and the GrenadinesSub-Saharan Africa Sub-Saharan Africa (excluding high income)Sub-Saharan Africa (IDA & IBRD countries)SudanSurinameSwazilandSwedenSwitzerlandSyrian Arab RepublicTajikistanTanzaniaThailandTimor-LesteTogoTongaTrinidad and TobagoTunisiaTurkeyUgandaUkraineUnited Arab EmiratesUnited KingdomUnited StatesUpper middle incomeUruguayVanuatuVenezuela, RBVietnamWest Bank and GazaWorldYemen, Rep.ZambiaZimbabwe Timeline:
This timeline shows a graph from 1961 to 2016 of Greece. No data until 1960. Number of actual observations by date: 56.
Source name:
World Development Indicators
Source organization:
International Monetary Fund, International Financial Statistics and data files, and World Bank and OECD GDP estimates.
Categories, topics:
Financial Sector
Last updated:
apr 23, 2017
Indicators value changes by year
Maximum:
66.802
jan 1, 1994
At the date of observation
Value
Absolute change
Change from previous value
jan 1, 1961
6.069
+6.069
0.0%
jan 1, 1962
5.91
-0.159
-2.63%
jan 1, 1963
5.216
-0.693
-11.73%
jan 1, 1964
5.371
+0.155
2.96%
jan 1, 1965
6.787
+1.416
26.36%
jan 1, 1966
6.55
-0.237
-3.49%
jan 1, 1967
6.501
-0.049
-0.74%
jan 1, 1968
6.455
-0.046
-0.72%
jan 1, 1969
6.925
+0.47
7.28%
jan 1, 1970
7.892
+0.967
13.97%
jan 1, 1971
7.622
-0.27
-3.42%
jan 1, 1972
8.496
+0.874
11.47%
jan 1, 1973
8.019
-0.476
-5.61%
jan 1, 1974
8.812
+0.793
9.89%
jan 1, 1975
10.004
+1.192
13.53%
jan 1, 1976
9.911
-0.093
-0.93%
jan 1, 1977
10.127
+0.216
2.17%
jan 1, 1978
11.941
+1.815
17.92%
jan 1, 1979
19.786
+7.844
65.69%
jan 1, 1980
20.589
+0.804
4.06%
jan 1, 1981
21.775
+1.186
5.76%
jan 1, 1982
26.935
+5.16
23.7%
jan 1, 1983
30.447
+3.512
13.04%
jan 1, 1984
31.897
+1.45
4.76%
jan 1, 1985
32.297
+0.399
1.25%
jan 1, 1986
35.195
+2.899
8.98%
jan 1, 1987
34.738
-0.457
-1.3%
jan 1, 1988
52.876
+18.138
52.21%
jan 1, 1989
52.877
+0.001
0.0%
jan 1, 1990
55.29
+2.413
4.56%
jan 1, 1991
54.107
-1.183
-2.14%
jan 1, 1992
48.43
-5.676
-10.49%
jan 1, 1993
51.88
+3.449
7.12%
jan 1, 1994
66.802
+14.922
28.76%
jan 1, 1995
58.812
-7.99
-11.96%
jan 1, 1996
53.252
-5.56
-9.45%
jan 1, 1997
48.041
-5.211
-9.78%
jan 1, 1998
43.835
-4.207
-8.76%
jan 1, 1999
39.282
-4.553
-10.39%
jan 1, 2000
39.989
+0.708
1.8%
jan 1, 2001
41.701
+1.712
4.28%
jan 1, 2002
39.255
-2.446
-5.87%
jan 1, 2003
35.581
-3.674
-9.36%
jan 1, 2004
26.706
-8.875
-24.94%
jan 1, 2005
22.364
-4.342
-16.26%
jan 1, 2006
25.277
+2.913
13.03%
jan 1, 2007
22.085
-3.192
-12.63%
jan 1, 2008
18.248
-3.838
-17.38%
jan 1, 2009
17.027
-1.22
-6.69%
jan 1, 2010
20.3
+3.273
19.22%
jan 1, 2011
28.536
+8.236
40.57%
jan 1, 2012
30.513
+1.977
6.93%
jan 1, 2013
14.048
-16.465
-53.96%
jan 1, 2014
10.946
-3.102
-22.08%
jan 1, 2015
13.159
+2.214
20.22%
jan 1, 2016
13.764
+0.605
4.59%
Ranking of countries by current statistics by years


Comments: