29
/
en
AIzaSyAYiBZKx7MnpbEhh9jyipgxe19OcubqV5w
April 1, 2024
31372
Europe & Central Asia (excluding high income)
ECA
false
2
1
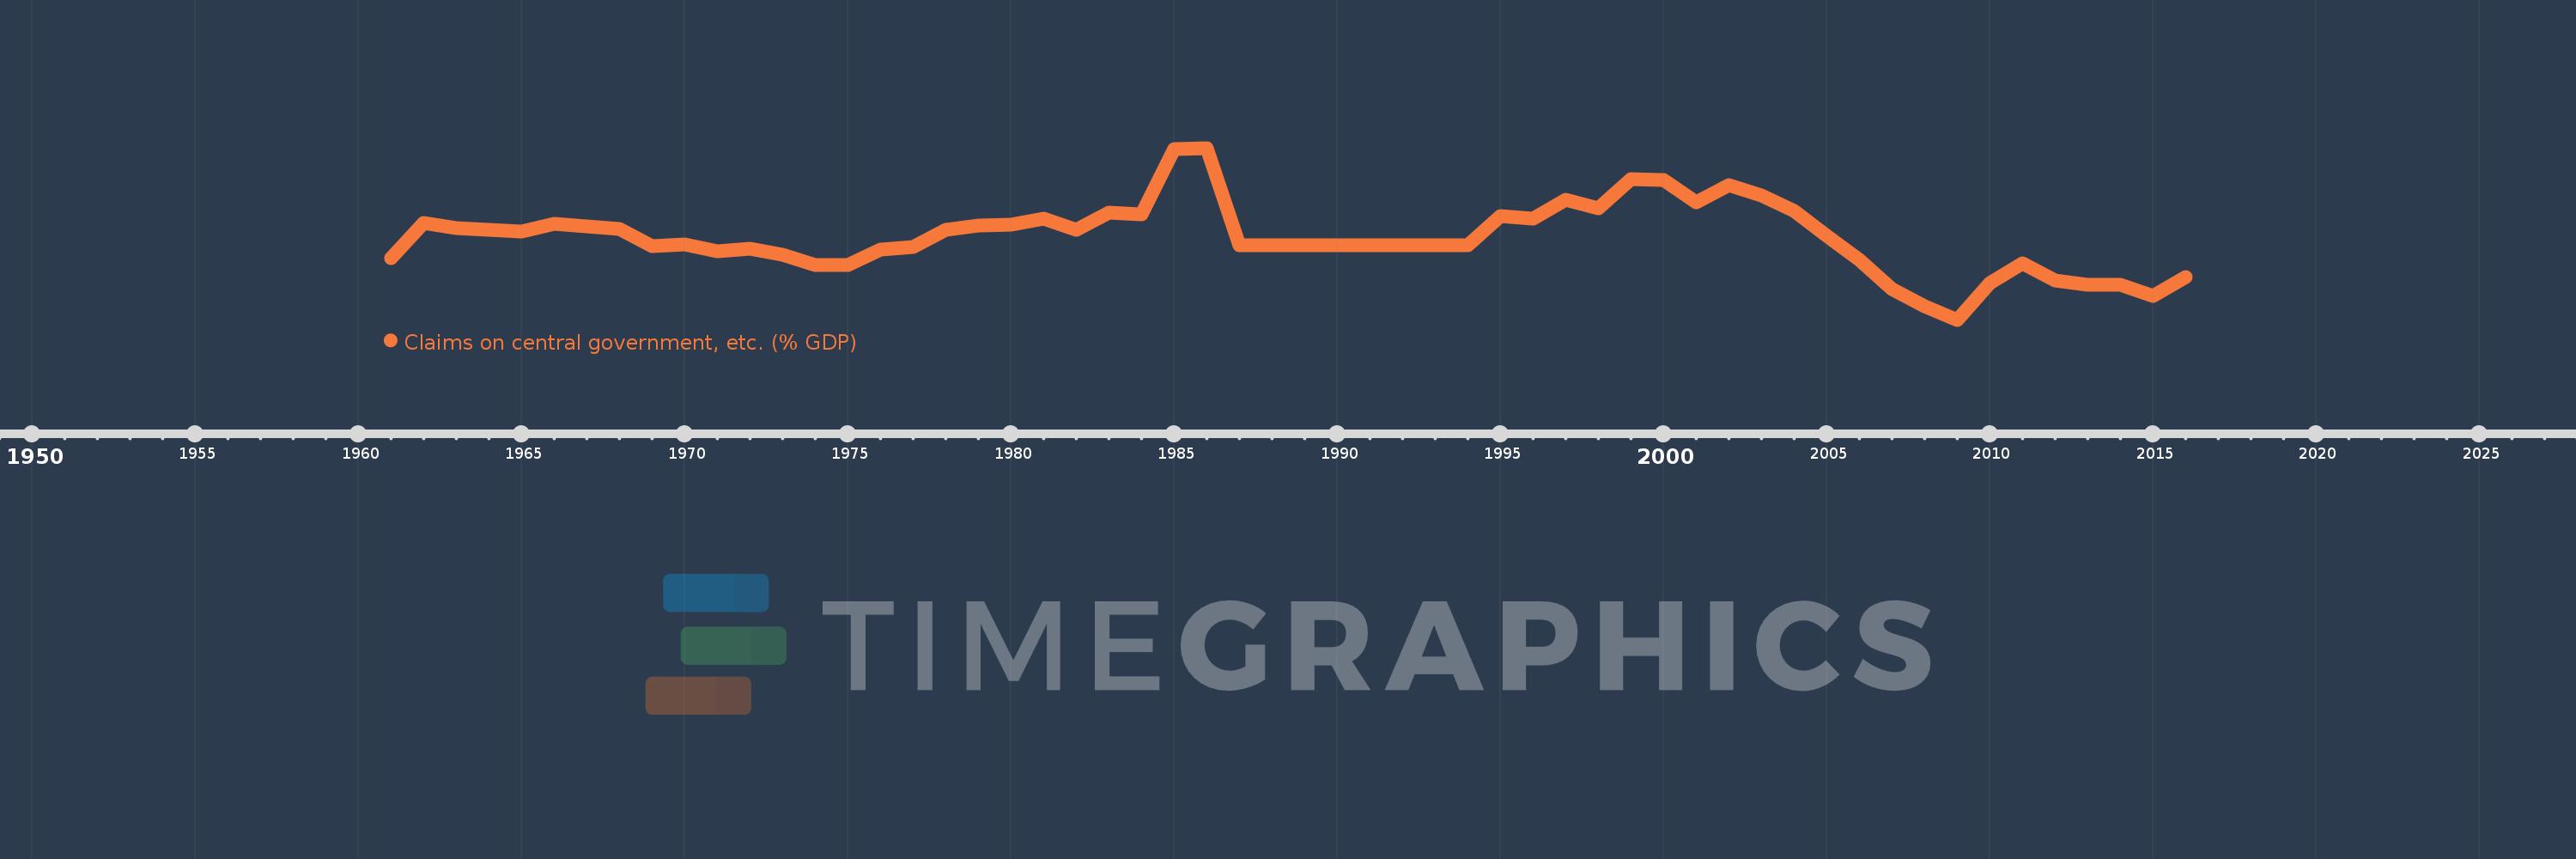
Claims on central government, etc. (% GDP)
2016,2015,2014,2013,2012,2011,2010,2009,2008,2007,2006,2005,2004,2003,2002,2001,2000,1999,1998,1997,1996,1995,1994,1987,1986,1985,1984,1983,1982,1981,1980,1979,1978,1977,1976,1975,1974,1973,1972,1971,1970,1969,1968,1967,1966,1965,1964,1963,1962,1961
This statistics in other country:
AfghanistanAlbaniaAlgeriaAngolaAntigua and BarbudaArab WorldArgentinaArmeniaArubaAustraliaAustriaAzerbaijanBahamas, TheBahrainBangladeshBarbadosBelarusBelgiumBelizeBeninBhutanBoliviaBosnia and HerzegovinaBotswanaBrazilBrunei DarussalamBulgariaBurkina FasoBurundiCabo VerdeCambodiaCameroonCanadaCaribbean small statesCentral African RepublicCentral Europe and the BalticsChadChileChinaColombiaComorosCongo, Dem. Rep.Congo, Rep.Costa RicaCote d'IvoireCroatiaCyprusCzech RepublicDenmarkDjiboutiDominicaDominican RepublicEarly-demographic dividendEast Asia & PacificEast Asia & Pacific (excluding high income)East Asia & Pacific (IDA & IBRD countries)EcuadorEgypt, Arab Rep.El SalvadorEquatorial GuineaEritreaEstoniaEthiopiaEuro areaEurope & Central AsiaEurope & Central Asia (excluding high income)Europe & Central Asia (IDA & IBRD countries)European UnionFijiFinlandFragile and conflict affected situationsFranceGabonGambia, TheGeorgiaGermanyGhanaGreeceGrenadaGuatemalaGuineaGuinea-BissauGuyanaHaitiHeavily indebted poor countries (HIPC)High incomeHondurasHong Kong SAR, ChinaHungaryIBRD onlyIcelandIDA & IBRD totalIDA blendIDA onlyIDA totalIndiaIndonesiaIran, Islamic Rep.IraqIrelandIsraelItalyJamaicaJapanJordanKazakhstanKenyaKorea, Rep.KosovoKuwaitKyrgyz RepublicLao PDRLate-demographic dividendLatin America & Caribbean Latin America & Caribbean (excluding high income)Latin America & the Caribbean (IDA & IBRD countries)LatviaLeast developed countries: UN classificationLebanonLesothoLiberiaLibyaLithuaniaLow & middle incomeLow incomeLower middle incomeLuxembourgMacao SAR, ChinaMacedonia, FYRMadagascarMalawiMalaysiaMaldivesMaliMaltaMauritaniaMauritiusMexicoMicronesia, Fed. Sts.Middle East & North AfricaMiddle East & North Africa (excluding high income)Middle East & North Africa (IDA & IBRD countries)Middle incomeMoldovaMongoliaMontenegroMoroccoMozambiqueMyanmarNamibiaNepalNetherlandsNew ZealandNicaraguaNigerNigeriaNorth AmericaNorwayOECD membersOmanOther small statesPacific island small statesPakistanPanamaPapua New GuineaParaguayPeruPhilippinesPolandPortugalPost-demographic dividendPre-demographic dividendQatarRomaniaRussian FederationRwandaSamoaSao Tome and PrincipeSaudi ArabiaSenegalSerbiaSeychellesSierra LeoneSingaporeSlovak RepublicSloveniaSmall statesSolomon IslandsSouth AfricaSouth AsiaSouth Asia (IDA & IBRD)South SudanSpainSri LankaSt. Kitts and NevisSt. LuciaSt. Vincent and the GrenadinesSub-Saharan Africa Sub-Saharan Africa (excluding high income)Sub-Saharan Africa (IDA & IBRD countries)SudanSurinameSwazilandSwedenSwitzerlandSyrian Arab RepublicTajikistanTanzaniaThailandTimor-LesteTogoTongaTrinidad and TobagoTunisiaTurkeyUgandaUkraineUnited Arab EmiratesUnited KingdomUnited StatesUpper middle incomeUruguayVanuatuVenezuela, RBVietnamWest Bank and GazaWorldYemen, Rep.ZambiaZimbabwe Timeline:
This timeline shows a graph from 1961 to 2016 of Europe & Central Asia (excluding high income). No data until 1960. Number of actual observations by date: 50.
Source name:
World Development Indicators
Source organization:
International Monetary Fund, International Financial Statistics and data files, and World Bank and OECD GDP estimates.
Categories, topics:
Financial Sector
Last updated:
apr 23, 2017
Indicators value changes by year
Minimum:
-5.661
jan 1, 2009
Maximum:
20.728
jan 1, 1986
At the date of observation
Value
Absolute change
Change from previous value
jan 1, 1961
3.833
+3.833
0.0%
jan 1, 1962
9.252
+5.419
141.4%
jan 1, 1963
8.443
-0.809
-8.74%
jan 1, 1964
8.101
-0.342
-4.06%
jan 1, 1965
7.942
-0.159
-1.96%
jan 1, 1966
9.126
+1.183
14.9%
jan 1, 1967
8.741
-0.384
-4.21%
jan 1, 1968
8.312
-0.429
-4.91%
jan 1, 1969
5.682
-2.63
-31.64%
jan 1, 1970
5.848
+0.165
2.91%
jan 1, 1971
4.915
-0.932
-15.94%
jan 1, 1972
5.199
+0.283
5.76%
jan 1, 1973
4.316
-0.883
-16.98%
jan 1, 1974
2.693
-1.623
-37.61%
jan 1, 1975
2.769
+0.076
2.83%
jan 1, 1976
5.163
+2.395
86.48%
jan 1, 1977
5.554
+0.39
7.56%
jan 1, 1978
8.088
+2.534
45.63%
jan 1, 1979
8.782
+0.694
8.58%
jan 1, 1980
8.921
+0.139
1.58%
jan 1, 1981
9.887
+0.966
10.83%
jan 1, 1982
8.137
-1.75
-17.7%
jan 1, 1983
10.811
+2.674
32.86%
jan 1, 1984
10.535
-0.275
-2.55%
jan 1, 1985
20.616
+10.081
95.69%
jan 1, 1986
20.728
+0.112
0.54%
jan 1, 1987
5.827
-14.901
-71.89%
jan 1, 1994
5.727
-0.1
-1.71%
jan 1, 1995
10.296
+4.569
79.78%
jan 1, 1996
9.83
-0.466
-4.53%
jan 1, 1997
12.757
+2.927
29.78%
jan 1, 1998
11.513
-1.244
-9.75%
jan 1, 1999
15.894
+4.381
38.05%
jan 1, 2000
15.86
-0.034
-0.21%
jan 1, 2001
12.414
-3.446
-21.73%
jan 1, 2002
14.985
+2.571
20.71%
jan 1, 2003
13.366
-1.619
-10.8%
jan 1, 2004
11.102
-2.264
-16.94%
jan 1, 2005
7.269
-3.832
-34.52%
jan 1, 2006
3.536
-3.734
-51.36%
jan 1, 2007
-0.954
-4.49
-126.99%
jan 1, 2008
-3.64
-2.685
281.41%
jan 1, 2009
-5.661
-2.021
55.53%
jan 1, 2010
-0.044
+5.617
-99.23%
jan 1, 2011
3.024
+3.068
-7.04K%
jan 1, 2012
0.422
-2.602
-86.03%
jan 1, 2013
-0.244
-0.667
-157.8%
jan 1, 2014
-0.236
+0.008
-3.39%
jan 1, 2015
-1.952
-1.716
727.53%
jan 1, 2016
0.946
+2.898
-148.46%
Ranking of countries by current statistics by years


Comments: