29
/
en
AIzaSyAYiBZKx7MnpbEhh9jyipgxe19OcubqV5w
April 1, 2024
42161
Latin America & Caribbean (excluding high income)
LAC
false
2
1
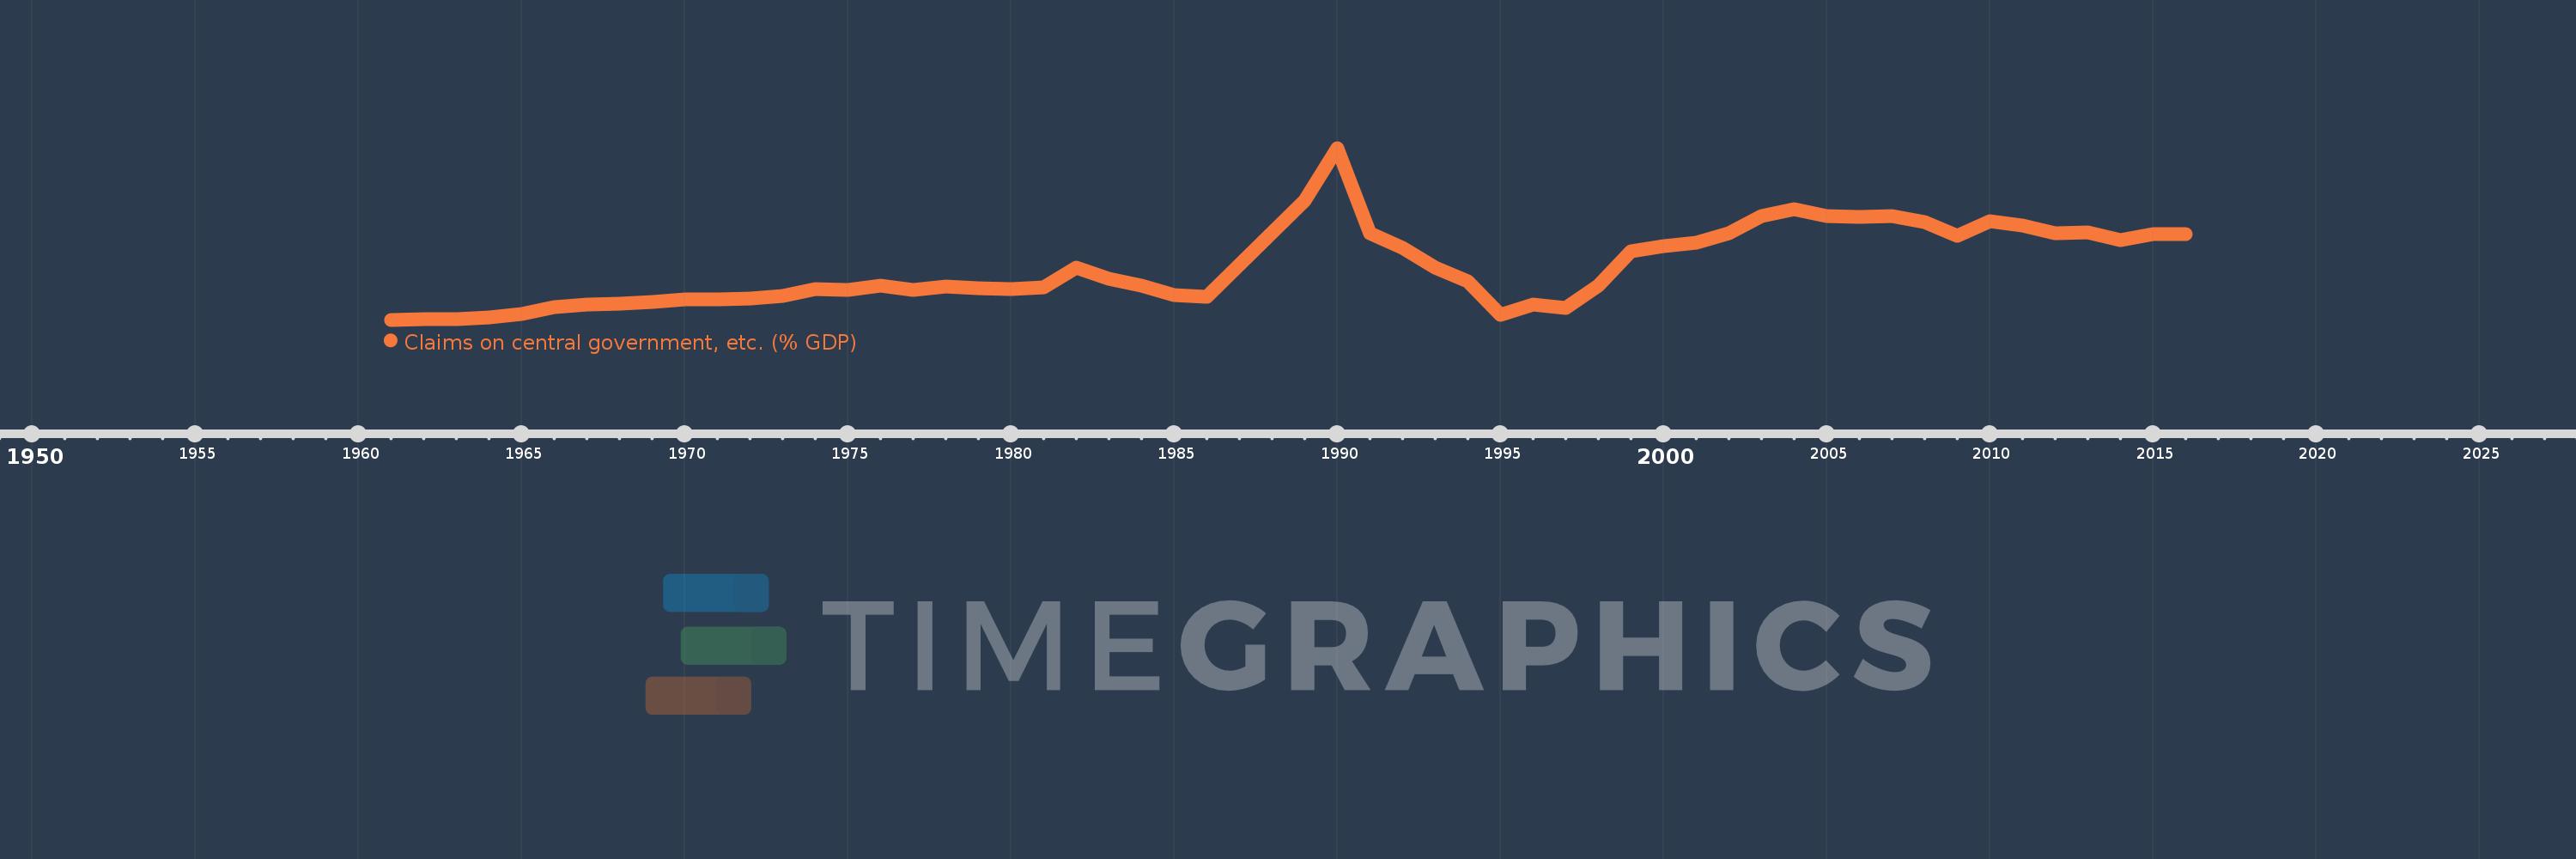
Claims on central government, etc. (% GDP)
2016,2015,2014,2013,2012,2011,2010,2009,2008,2007,2006,2005,2004,2003,2002,2001,2000,1999,1998,1997,1996,1995,1994,1993,1992,1991,1990,1989,1986,1985,1984,1983,1982,1981,1980,1979,1978,1977,1976,1975,1974,1973,1972,1971,1970,1969,1968,1967,1966,1965,1964,1963,1962,1961
This statistics in other country:
AfghanistanAlbaniaAlgeriaAngolaAntigua and BarbudaArab WorldArgentinaArmeniaArubaAustraliaAustriaAzerbaijanBahamas, TheBahrainBangladeshBarbadosBelarusBelgiumBelizeBeninBhutanBoliviaBosnia and HerzegovinaBotswanaBrazilBrunei DarussalamBulgariaBurkina FasoBurundiCabo VerdeCambodiaCameroonCanadaCaribbean small statesCentral African RepublicCentral Europe and the BalticsChadChileChinaColombiaComorosCongo, Dem. Rep.Congo, Rep.Costa RicaCote d'IvoireCroatiaCyprusCzech RepublicDenmarkDjiboutiDominicaDominican RepublicEarly-demographic dividendEast Asia & PacificEast Asia & Pacific (excluding high income)East Asia & Pacific (IDA & IBRD countries)EcuadorEgypt, Arab Rep.El SalvadorEquatorial GuineaEritreaEstoniaEthiopiaEuro areaEurope & Central AsiaEurope & Central Asia (excluding high income)Europe & Central Asia (IDA & IBRD countries)European UnionFijiFinlandFragile and conflict affected situationsFranceGabonGambia, TheGeorgiaGermanyGhanaGreeceGrenadaGuatemalaGuineaGuinea-BissauGuyanaHaitiHeavily indebted poor countries (HIPC)High incomeHondurasHong Kong SAR, ChinaHungaryIBRD onlyIcelandIDA & IBRD totalIDA blendIDA onlyIDA totalIndiaIndonesiaIran, Islamic Rep.IraqIrelandIsraelItalyJamaicaJapanJordanKazakhstanKenyaKorea, Rep.KosovoKuwaitKyrgyz RepublicLao PDRLate-demographic dividendLatin America & Caribbean Latin America & Caribbean (excluding high income)Latin America & the Caribbean (IDA & IBRD countries)LatviaLeast developed countries: UN classificationLebanonLesothoLiberiaLibyaLithuaniaLow & middle incomeLow incomeLower middle incomeLuxembourgMacao SAR, ChinaMacedonia, FYRMadagascarMalawiMalaysiaMaldivesMaliMaltaMauritaniaMauritiusMexicoMicronesia, Fed. Sts.Middle East & North AfricaMiddle East & North Africa (excluding high income)Middle East & North Africa (IDA & IBRD countries)Middle incomeMoldovaMongoliaMontenegroMoroccoMozambiqueMyanmarNamibiaNepalNetherlandsNew ZealandNicaraguaNigerNigeriaNorth AmericaNorwayOECD membersOmanOther small statesPacific island small statesPakistanPanamaPapua New GuineaParaguayPeruPhilippinesPolandPortugalPost-demographic dividendPre-demographic dividendQatarRomaniaRussian FederationRwandaSamoaSao Tome and PrincipeSaudi ArabiaSenegalSerbiaSeychellesSierra LeoneSingaporeSlovak RepublicSloveniaSmall statesSolomon IslandsSouth AfricaSouth AsiaSouth Asia (IDA & IBRD)South SudanSpainSri LankaSt. Kitts and NevisSt. LuciaSt. Vincent and the GrenadinesSub-Saharan Africa Sub-Saharan Africa (excluding high income)Sub-Saharan Africa (IDA & IBRD countries)SudanSurinameSwazilandSwedenSwitzerlandSyrian Arab RepublicTajikistanTanzaniaThailandTimor-LesteTogoTongaTrinidad and TobagoTunisiaTurkeyUgandaUkraineUnited Arab EmiratesUnited KingdomUnited StatesUpper middle incomeUruguayVanuatuVenezuela, RBVietnamWest Bank and GazaWorldYemen, Rep.ZambiaZimbabwe Timeline:
This timeline shows a graph from 1961 to 2016 of Latin America & Caribbean (excluding high income). No data until 1960. Number of actual observations by date: 54.
Source name:
World Development Indicators
Source organization:
International Monetary Fund, International Financial Statistics and data files, and World Bank and OECD GDP estimates.
Categories, topics:
Financial Sector
Last updated:
apr 23, 2017
Indicators value changes by year
Maximum:
35.515
jan 1, 1990
At the date of observation
Value
Absolute change
Change from previous value
jan 1, 1961
2.449
+2.449
0.0%
jan 1, 1962
2.547
+0.098
4.0%
jan 1, 1963
2.491
-0.056
-2.2%
jan 1, 1964
2.855
+0.365
14.65%
jan 1, 1965
3.522
+0.667
23.35%
jan 1, 1966
4.88
+1.358
38.55%
jan 1, 1967
5.358
+0.478
9.8%
jan 1, 1968
5.525
+0.166
3.1%
jan 1, 1969
5.792
+0.268
4.85%
jan 1, 1970
6.365
+0.572
9.88%
jan 1, 1971
6.35
-0.015
-0.23%
jan 1, 1972
6.608
+0.258
4.06%
jan 1, 1973
7.071
+0.463
7.01%
jan 1, 1974
8.353
+1.282
18.13%
jan 1, 1975
8.138
-0.215
-2.57%
jan 1, 1976
8.999
+0.861
10.58%
jan 1, 1977
8.23
-0.769
-8.55%
jan 1, 1978
8.848
+0.618
7.51%
jan 1, 1979
8.58
-0.268
-3.03%
jan 1, 1980
8.377
-0.202
-2.36%
jan 1, 1981
8.703
+0.326
3.89%
jan 1, 1982
12.525
+3.822
43.91%
jan 1, 1983
10.361
-2.164
-17.28%
jan 1, 1984
9.041
-1.32
-12.74%
jan 1, 1985
7.115
-1.925
-21.3%
jan 1, 1986
6.907
-0.208
-2.93%
jan 1, 1989
25.352
+18.445
267.06%
jan 1, 1990
35.515
+10.164
40.09%
jan 1, 1991
19.059
-16.457
-46.34%
jan 1, 1992
16.232
-2.826
-14.83%
jan 1, 1993
12.454
-3.778
-23.28%
jan 1, 1994
9.779
-2.675
-21.48%
jan 1, 1995
3.44
-6.339
-64.82%
jan 1, 1996
5.366
+1.926
55.97%
jan 1, 1997
4.747
-0.618
-11.53%
jan 1, 1998
8.993
+4.246
89.43%
jan 1, 1999
15.705
+6.712
74.63%
jan 1, 2000
16.593
+0.888
5.66%
jan 1, 2001
17.213
+0.62
3.74%
jan 1, 2002
19.134
+1.921
11.16%
jan 1, 2003
22.331
+3.198
16.71%
jan 1, 2004
23.711
+1.379
6.18%
jan 1, 2005
22.374
-1.337
-5.64%
jan 1, 2006
22.305
-0.068
-0.3%
jan 1, 2007
22.473
+0.168
0.75%
jan 1, 2008
21.172
-1.301
-5.79%
jan 1, 2009
18.575
-2.597
-12.27%
jan 1, 2010
21.38
+2.805
15.1%
jan 1, 2011
20.52
-0.86
-4.02%
jan 1, 2012
19.113
-1.407
-6.86%
jan 1, 2013
19.298
+0.185
0.97%
jan 1, 2014
17.759
-1.538
-7.97%
jan 1, 2015
18.885
+1.126
6.34%
jan 1, 2016
18.88
-0.005
-0.02%
Ranking of countries by current statistics by years


Comments: