29
/
en
AIzaSyAYiBZKx7MnpbEhh9jyipgxe19OcubqV5w
April 1, 2024
24723
Caribbean small states
CSS
false
2
1
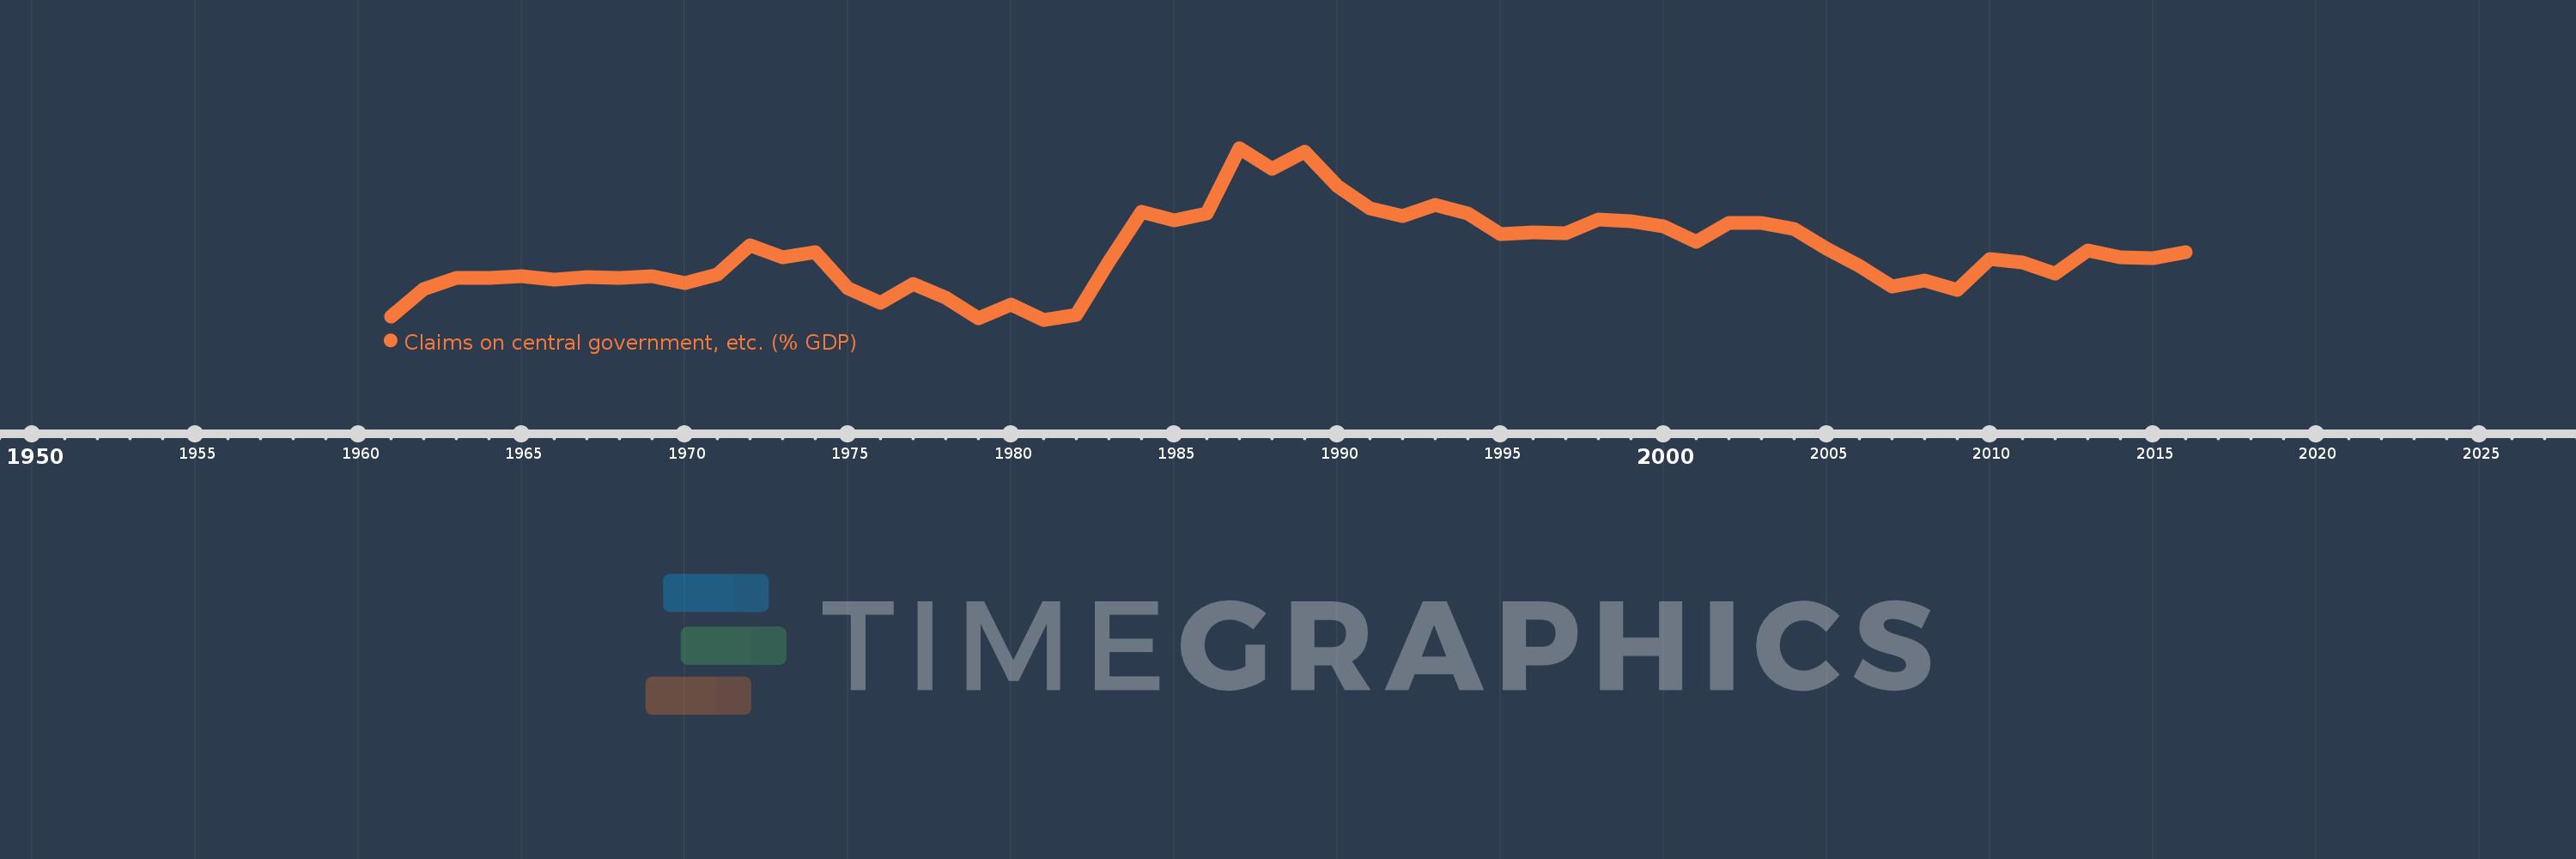
Claims on central government, etc. (% GDP)
2016,2015,2014,2013,2012,2011,2010,2009,2008,2007,2006,2005,2004,2003,2002,2001,2000,1999,1998,1997,1996,1995,1994,1993,1992,1991,1990,1989,1988,1987,1986,1985,1984,1983,1982,1981,1980,1979,1978,1977,1976,1975,1974,1973,1972,1971,1970,1969,1968,1967,1966,1965,1964,1963,1962,1961
This statistics in other country:
AfghanistanAlbaniaAlgeriaAngolaAntigua and BarbudaArab WorldArgentinaArmeniaArubaAustraliaAustriaAzerbaijanBahamas, TheBahrainBangladeshBarbadosBelarusBelgiumBelizeBeninBhutanBoliviaBosnia and HerzegovinaBotswanaBrazilBrunei DarussalamBulgariaBurkina FasoBurundiCabo VerdeCambodiaCameroonCanadaCaribbean small statesCentral African RepublicCentral Europe and the BalticsChadChileChinaColombiaComorosCongo, Dem. Rep.Congo, Rep.Costa RicaCote d'IvoireCroatiaCyprusCzech RepublicDenmarkDjiboutiDominicaDominican RepublicEarly-demographic dividendEast Asia & PacificEast Asia & Pacific (excluding high income)East Asia & Pacific (IDA & IBRD countries)EcuadorEgypt, Arab Rep.El SalvadorEquatorial GuineaEritreaEstoniaEthiopiaEuro areaEurope & Central AsiaEurope & Central Asia (excluding high income)Europe & Central Asia (IDA & IBRD countries)European UnionFijiFinlandFragile and conflict affected situationsFranceGabonGambia, TheGeorgiaGermanyGhanaGreeceGrenadaGuatemalaGuineaGuinea-BissauGuyanaHaitiHeavily indebted poor countries (HIPC)High incomeHondurasHong Kong SAR, ChinaHungaryIBRD onlyIcelandIDA & IBRD totalIDA blendIDA onlyIDA totalIndiaIndonesiaIran, Islamic Rep.IraqIrelandIsraelItalyJamaicaJapanJordanKazakhstanKenyaKorea, Rep.KosovoKuwaitKyrgyz RepublicLao PDRLate-demographic dividendLatin America & Caribbean Latin America & Caribbean (excluding high income)Latin America & the Caribbean (IDA & IBRD countries)LatviaLeast developed countries: UN classificationLebanonLesothoLiberiaLibyaLithuaniaLow & middle incomeLow incomeLower middle incomeLuxembourgMacao SAR, ChinaMacedonia, FYRMadagascarMalawiMalaysiaMaldivesMaliMaltaMauritaniaMauritiusMexicoMicronesia, Fed. Sts.Middle East & North AfricaMiddle East & North Africa (excluding high income)Middle East & North Africa (IDA & IBRD countries)Middle incomeMoldovaMongoliaMontenegroMoroccoMozambiqueMyanmarNamibiaNepalNetherlandsNew ZealandNicaraguaNigerNigeriaNorth AmericaNorwayOECD membersOmanOther small statesPacific island small statesPakistanPanamaPapua New GuineaParaguayPeruPhilippinesPolandPortugalPost-demographic dividendPre-demographic dividendQatarRomaniaRussian FederationRwandaSamoaSao Tome and PrincipeSaudi ArabiaSenegalSerbiaSeychellesSierra LeoneSingaporeSlovak RepublicSloveniaSmall statesSolomon IslandsSouth AfricaSouth AsiaSouth Asia (IDA & IBRD)South SudanSpainSri LankaSt. Kitts and NevisSt. LuciaSt. Vincent and the GrenadinesSub-Saharan Africa Sub-Saharan Africa (excluding high income)Sub-Saharan Africa (IDA & IBRD countries)SudanSurinameSwazilandSwedenSwitzerlandSyrian Arab RepublicTajikistanTanzaniaThailandTimor-LesteTogoTongaTrinidad and TobagoTunisiaTurkeyUgandaUkraineUnited Arab EmiratesUnited KingdomUnited StatesUpper middle incomeUruguayVanuatuVenezuela, RBVietnamWest Bank and GazaWorldYemen, Rep.ZambiaZimbabwe Timeline:
This timeline shows a graph from 1961 to 2016 of Caribbean small states. No data until 1960. Number of actual observations by date: 56.
Source name:
World Development Indicators
Source organization:
International Monetary Fund, International Financial Statistics and data files, and World Bank and OECD GDP estimates.
Categories, topics:
Financial Sector
Last updated:
apr 23, 2017
Indicators value changes by year
Minimum:
-4.328
jan 1, 1981
Maximum:
25.217
jan 1, 1987
At the date of observation
Value
Absolute change
Change from previous value
jan 1, 1961
-3.793
-3.793
0.0%
jan 1, 1962
0.979
+4.772
-125.8%
jan 1, 1963
2.864
+1.885
192.65%
jan 1, 1964
2.793
-0.071
-2.49%
jan 1, 1965
3.13
+0.337
12.08%
jan 1, 1966
2.634
-0.496
-15.86%
jan 1, 1967
3.082
+0.448
17.0%
jan 1, 1968
2.836
-0.245
-7.96%
jan 1, 1969
3.143
+0.307
10.81%
jan 1, 1970
2.009
-1.134
-36.08%
jan 1, 1971
3.41
+1.401
69.75%
jan 1, 1972
8.432
+5.022
147.25%
jan 1, 1973
6.458
-1.975
-23.42%
jan 1, 1974
7.283
+0.826
12.78%
jan 1, 1975
1.04
-6.243
-85.72%
jan 1, 1976
-1.454
-2.495
-239.77%
jan 1, 1977
1.9
+3.354
-230.68%
jan 1, 1978
-0.499
-2.399
-126.26%
jan 1, 1979
-4.022
-3.523
706.02%
jan 1, 1980
-1.701
+2.321
-57.71%
jan 1, 1981
-4.328
-2.627
154.47%
jan 1, 1982
-3.436
+0.893
-20.62%
jan 1, 1983
5.7
+9.136
-265.91%
jan 1, 1984
14.231
+8.531
149.67%
jan 1, 1985
12.769
-1.463
-10.28%
jan 1, 1986
13.935
+1.166
9.13%
jan 1, 1987
25.217
+11.282
80.97%
jan 1, 1988
21.588
-3.629
-14.39%
jan 1, 1989
24.644
+3.056
14.15%
jan 1, 1990
18.732
-5.912
-23.99%
jan 1, 1991
14.779
-3.953
-21.1%
jan 1, 1992
13.448
-1.331
-9.0%
jan 1, 1993
15.401
+1.953
14.52%
jan 1, 1994
13.883
-1.518
-9.86%
jan 1, 1995
10.336
-3.547
-25.55%
jan 1, 1996
10.713
+0.377
3.65%
jan 1, 1997
10.559
-0.154
-1.44%
jan 1, 1998
12.975
+2.416
22.88%
jan 1, 1999
12.572
-0.404
-3.11%
jan 1, 2000
11.777
-0.794
-6.32%
jan 1, 2001
9.117
-2.66
-22.59%
jan 1, 2002
12.314
+3.196
35.06%
jan 1, 2003
12.274
-0.04
-0.33%
jan 1, 2004
11.357
-0.916
-7.46%
jan 1, 2005
7.907
-3.45
-30.38%
jan 1, 2006
4.905
-3.002
-37.96%
jan 1, 2007
1.335
-3.571
-72.79%
jan 1, 2008
2.475
+1.14
85.43%
jan 1, 2009
0.847
-1.628
-65.79%
jan 1, 2010
6.156
+5.309
627.13%
jan 1, 2011
5.55
-0.606
-9.85%
jan 1, 2012
3.668
-1.882
-33.91%
jan 1, 2013
7.658
+3.99
108.79%
jan 1, 2014
6.351
-1.307
-17.06%
jan 1, 2015
6.223
-0.128
-2.02%
jan 1, 2016
7.342
+1.119
17.98%
Ranking of countries by current statistics by years


Comments: