29
/
en
AIzaSyAYiBZKx7MnpbEhh9jyipgxe19OcubqV5w
April 1, 2024
154334
India
IND
true
2
1
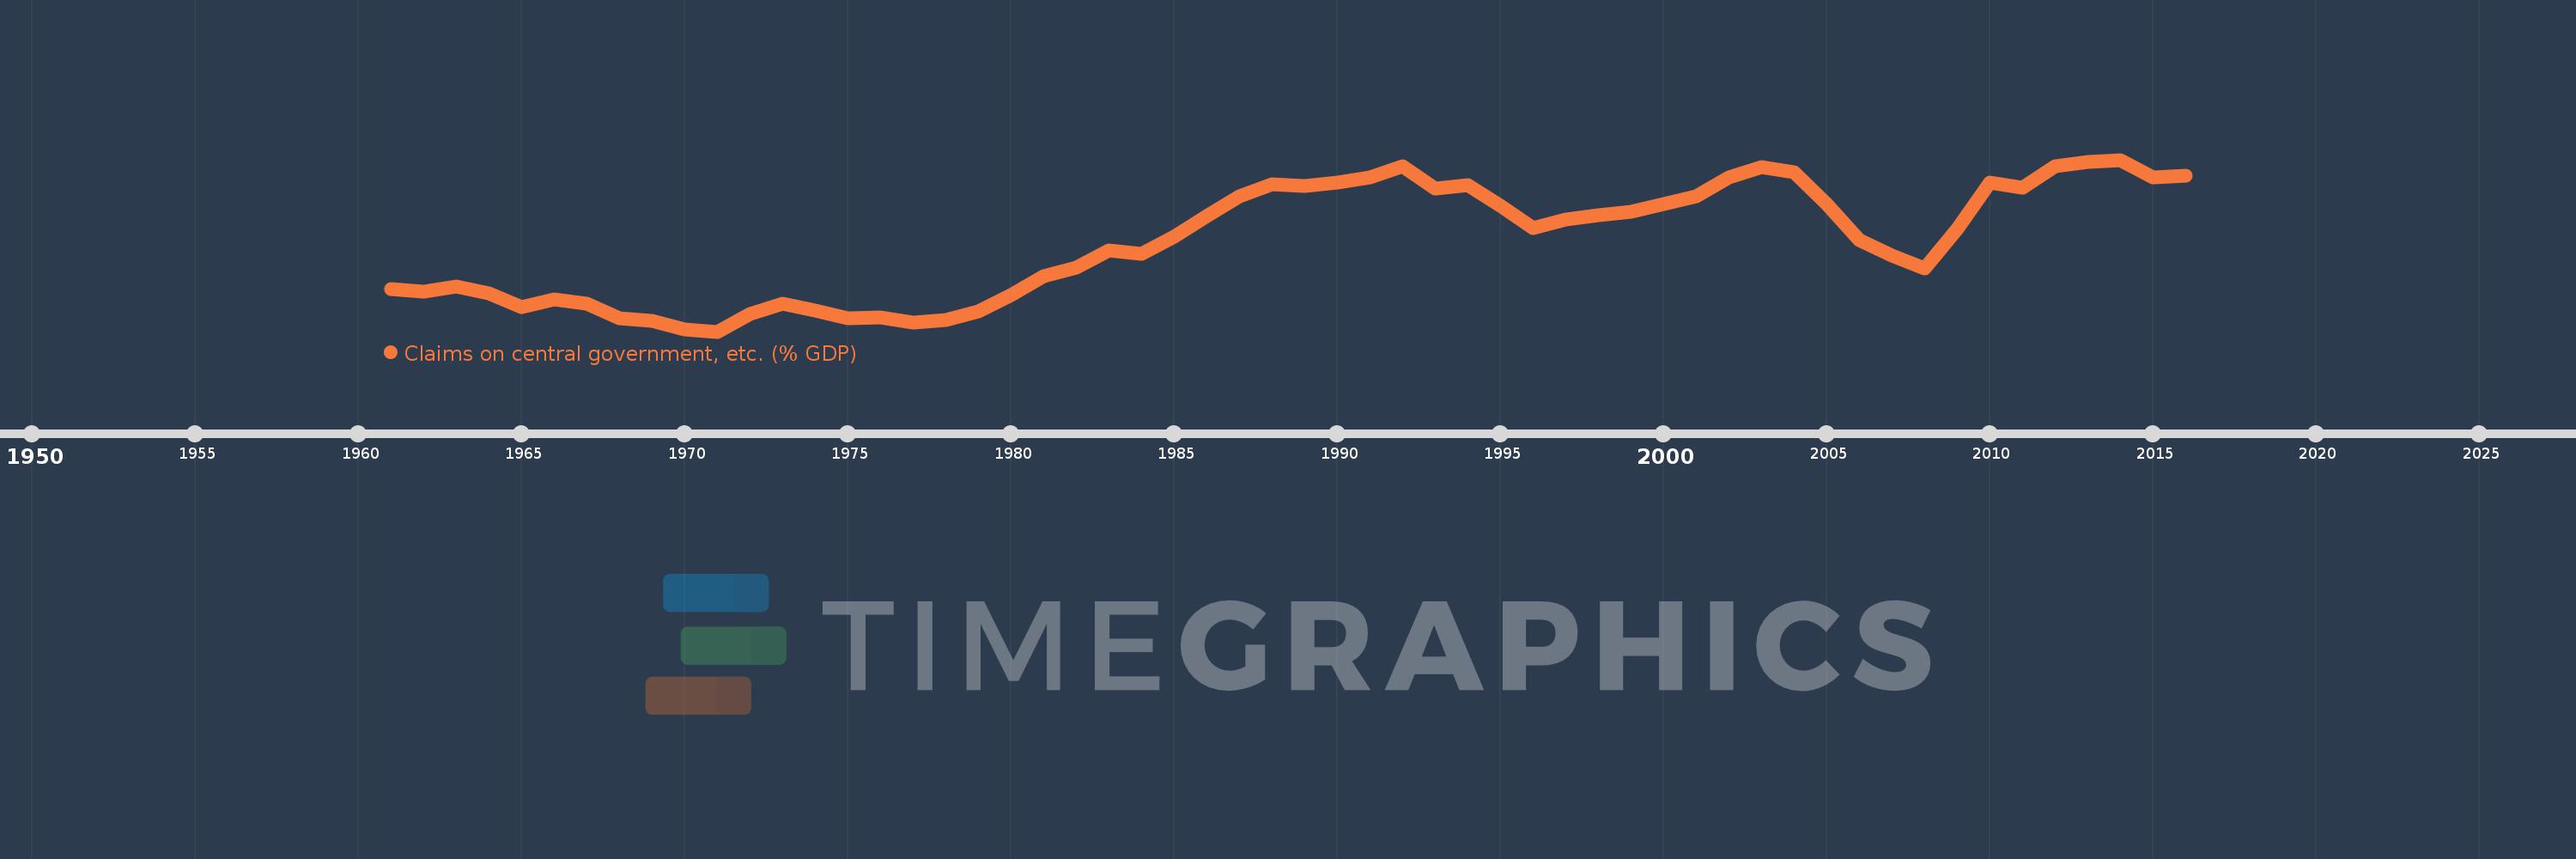
Claims on central government, etc. (% GDP)
2016,2015,2014,2013,2012,2011,2010,2009,2008,2007,2006,2005,2004,2003,2002,2001,2000,1999,1998,1997,1996,1995,1994,1993,1992,1991,1990,1989,1988,1987,1986,1985,1984,1983,1982,1981,1980,1979,1978,1977,1976,1975,1974,1973,1972,1971,1970,1969,1968,1967,1966,1965,1964,1963,1962,1961
This statistics in other country:
AfghanistanAlbaniaAlgeriaAngolaAntigua and BarbudaArab WorldArgentinaArmeniaArubaAustraliaAustriaAzerbaijanBahamas, TheBahrainBangladeshBarbadosBelarusBelgiumBelizeBeninBhutanBoliviaBosnia and HerzegovinaBotswanaBrazilBrunei DarussalamBulgariaBurkina FasoBurundiCabo VerdeCambodiaCameroonCanadaCaribbean small statesCentral African RepublicCentral Europe and the BalticsChadChileChinaColombiaComorosCongo, Dem. Rep.Congo, Rep.Costa RicaCote d'IvoireCroatiaCyprusCzech RepublicDenmarkDjiboutiDominicaDominican RepublicEarly-demographic dividendEast Asia & PacificEast Asia & Pacific (excluding high income)East Asia & Pacific (IDA & IBRD countries)EcuadorEgypt, Arab Rep.El SalvadorEquatorial GuineaEritreaEstoniaEthiopiaEuro areaEurope & Central AsiaEurope & Central Asia (excluding high income)Europe & Central Asia (IDA & IBRD countries)European UnionFijiFinlandFragile and conflict affected situationsFranceGabonGambia, TheGeorgiaGermanyGhanaGreeceGrenadaGuatemalaGuineaGuinea-BissauGuyanaHaitiHeavily indebted poor countries (HIPC)High incomeHondurasHong Kong SAR, ChinaHungaryIBRD onlyIcelandIDA & IBRD totalIDA blendIDA onlyIDA totalIndiaIndonesiaIran, Islamic Rep.IraqIrelandIsraelItalyJamaicaJapanJordanKazakhstanKenyaKorea, Rep.KosovoKuwaitKyrgyz RepublicLao PDRLate-demographic dividendLatin America & Caribbean Latin America & Caribbean (excluding high income)Latin America & the Caribbean (IDA & IBRD countries)LatviaLeast developed countries: UN classificationLebanonLesothoLiberiaLibyaLithuaniaLow & middle incomeLow incomeLower middle incomeLuxembourgMacao SAR, ChinaMacedonia, FYRMadagascarMalawiMalaysiaMaldivesMaliMaltaMauritaniaMauritiusMexicoMicronesia, Fed. Sts.Middle East & North AfricaMiddle East & North Africa (excluding high income)Middle East & North Africa (IDA & IBRD countries)Middle incomeMoldovaMongoliaMontenegroMoroccoMozambiqueMyanmarNamibiaNepalNetherlandsNew ZealandNicaraguaNigerNigeriaNorth AmericaNorwayOECD membersOmanOther small statesPacific island small statesPakistanPanamaPapua New GuineaParaguayPeruPhilippinesPolandPortugalPost-demographic dividendPre-demographic dividendQatarRomaniaRussian FederationRwandaSamoaSao Tome and PrincipeSaudi ArabiaSenegalSerbiaSeychellesSierra LeoneSingaporeSlovak RepublicSloveniaSmall statesSolomon IslandsSouth AfricaSouth AsiaSouth Asia (IDA & IBRD)South SudanSpainSri LankaSt. Kitts and NevisSt. LuciaSt. Vincent and the GrenadinesSub-Saharan Africa Sub-Saharan Africa (excluding high income)Sub-Saharan Africa (IDA & IBRD countries)SudanSurinameSwazilandSwedenSwitzerlandSyrian Arab RepublicTajikistanTanzaniaThailandTimor-LesteTogoTongaTrinidad and TobagoTunisiaTurkeyUgandaUkraineUnited Arab EmiratesUnited KingdomUnited StatesUpper middle incomeUruguayVanuatuVenezuela, RBVietnamWest Bank and GazaWorldYemen, Rep.ZambiaZimbabwe Timeline:
This timeline shows a graph from 1961 to 2016 of India. No data until 1960. Number of actual observations by date: 56.
Source name:
World Development Indicators
Source organization:
International Monetary Fund, International Financial Statistics and data files, and World Bank and OECD GDP estimates.
Categories, topics:
Financial Sector
Last updated:
apr 23, 2017
Indicators value changes by year
Minimum:
11.202
jan 1, 1971
Maximum:
25.377
jan 1, 2014
At the date of observation
Value
Absolute change
Change from previous value
jan 1, 1961
14.742
+14.742
0.0%
jan 1, 1962
14.472
-0.27
-1.83%
jan 1, 1963
14.925
+0.453
3.13%
jan 1, 1964
14.389
-0.536
-3.59%
jan 1, 1965
13.217
-1.172
-8.15%
jan 1, 1966
13.851
+0.634
4.8%
jan 1, 1967
13.53
-0.321
-2.32%
jan 1, 1968
12.284
-1.246
-9.21%
jan 1, 1969
12.063
-0.221
-1.8%
jan 1, 1970
11.386
-0.677
-5.61%
jan 1, 1971
11.202
-0.184
-1.62%
jan 1, 1972
12.644
+1.443
12.88%
jan 1, 1973
13.495
+0.851
6.73%
jan 1, 1974
12.945
-0.55
-4.08%
jan 1, 1975
12.317
-0.628
-4.85%
jan 1, 1976
12.385
+0.068
0.56%
jan 1, 1977
11.94
-0.446
-3.6%
jan 1, 1978
12.144
+0.204
1.71%
jan 1, 1979
12.842
+0.698
5.75%
jan 1, 1980
14.194
+1.353
10.53%
jan 1, 1981
15.774
+1.58
11.13%
jan 1, 1982
16.515
+0.741
4.7%
jan 1, 1983
17.89
+1.375
8.33%
jan 1, 1984
17.62
-0.27
-1.51%
jan 1, 1985
19.045
+1.425
8.08%
jan 1, 1986
20.719
+1.674
8.79%
jan 1, 1987
22.381
+1.663
8.03%
jan 1, 1988
23.355
+0.973
4.35%
jan 1, 1989
23.203
-0.152
-0.65%
jan 1, 1990
23.513
+0.31
1.34%
jan 1, 1991
23.923
+0.409
1.74%
jan 1, 1992
24.812
+0.889
3.72%
jan 1, 1993
22.996
-1.815
-7.32%
jan 1, 1994
23.302
+0.306
1.33%
jan 1, 1995
21.591
-1.711
-7.34%
jan 1, 1996
19.715
-1.877
-8.69%
jan 1, 1997
20.474
+0.76
3.85%
jan 1, 1998
20.793
+0.319
1.56%
jan 1, 1999
21.118
+0.325
1.56%
jan 1, 2000
21.737
+0.619
2.93%
jan 1, 2001
22.37
+0.633
2.91%
jan 1, 2002
23.915
+1.545
6.91%
jan 1, 2003
24.785
+0.869
3.64%
jan 1, 2004
24.363
-0.421
-1.7%
jan 1, 2005
21.761
-2.602
-10.68%
jan 1, 2006
18.769
-2.992
-13.75%
jan 1, 2007
17.49
-1.278
-6.81%
jan 1, 2008
16.432
-1.058
-6.05%
jan 1, 2009
19.682
+3.251
19.78%
jan 1, 2010
23.471
+3.788
19.25%
jan 1, 2011
23.04
-0.43
-1.83%
jan 1, 2012
24.82
+1.78
7.72%
jan 1, 2013
25.235
+0.415
1.67%
jan 1, 2014
25.377
+0.142
0.56%
jan 1, 2015
23.941
-1.436
-5.66%
jan 1, 2016
24.038
+0.097
0.41%
Ranking of countries by current statistics by years


Comments: