29
/
en
AIzaSyAYiBZKx7MnpbEhh9jyipgxe19OcubqV5w
April 1, 2024
44881
Low & middle income
LMY
false
2
1
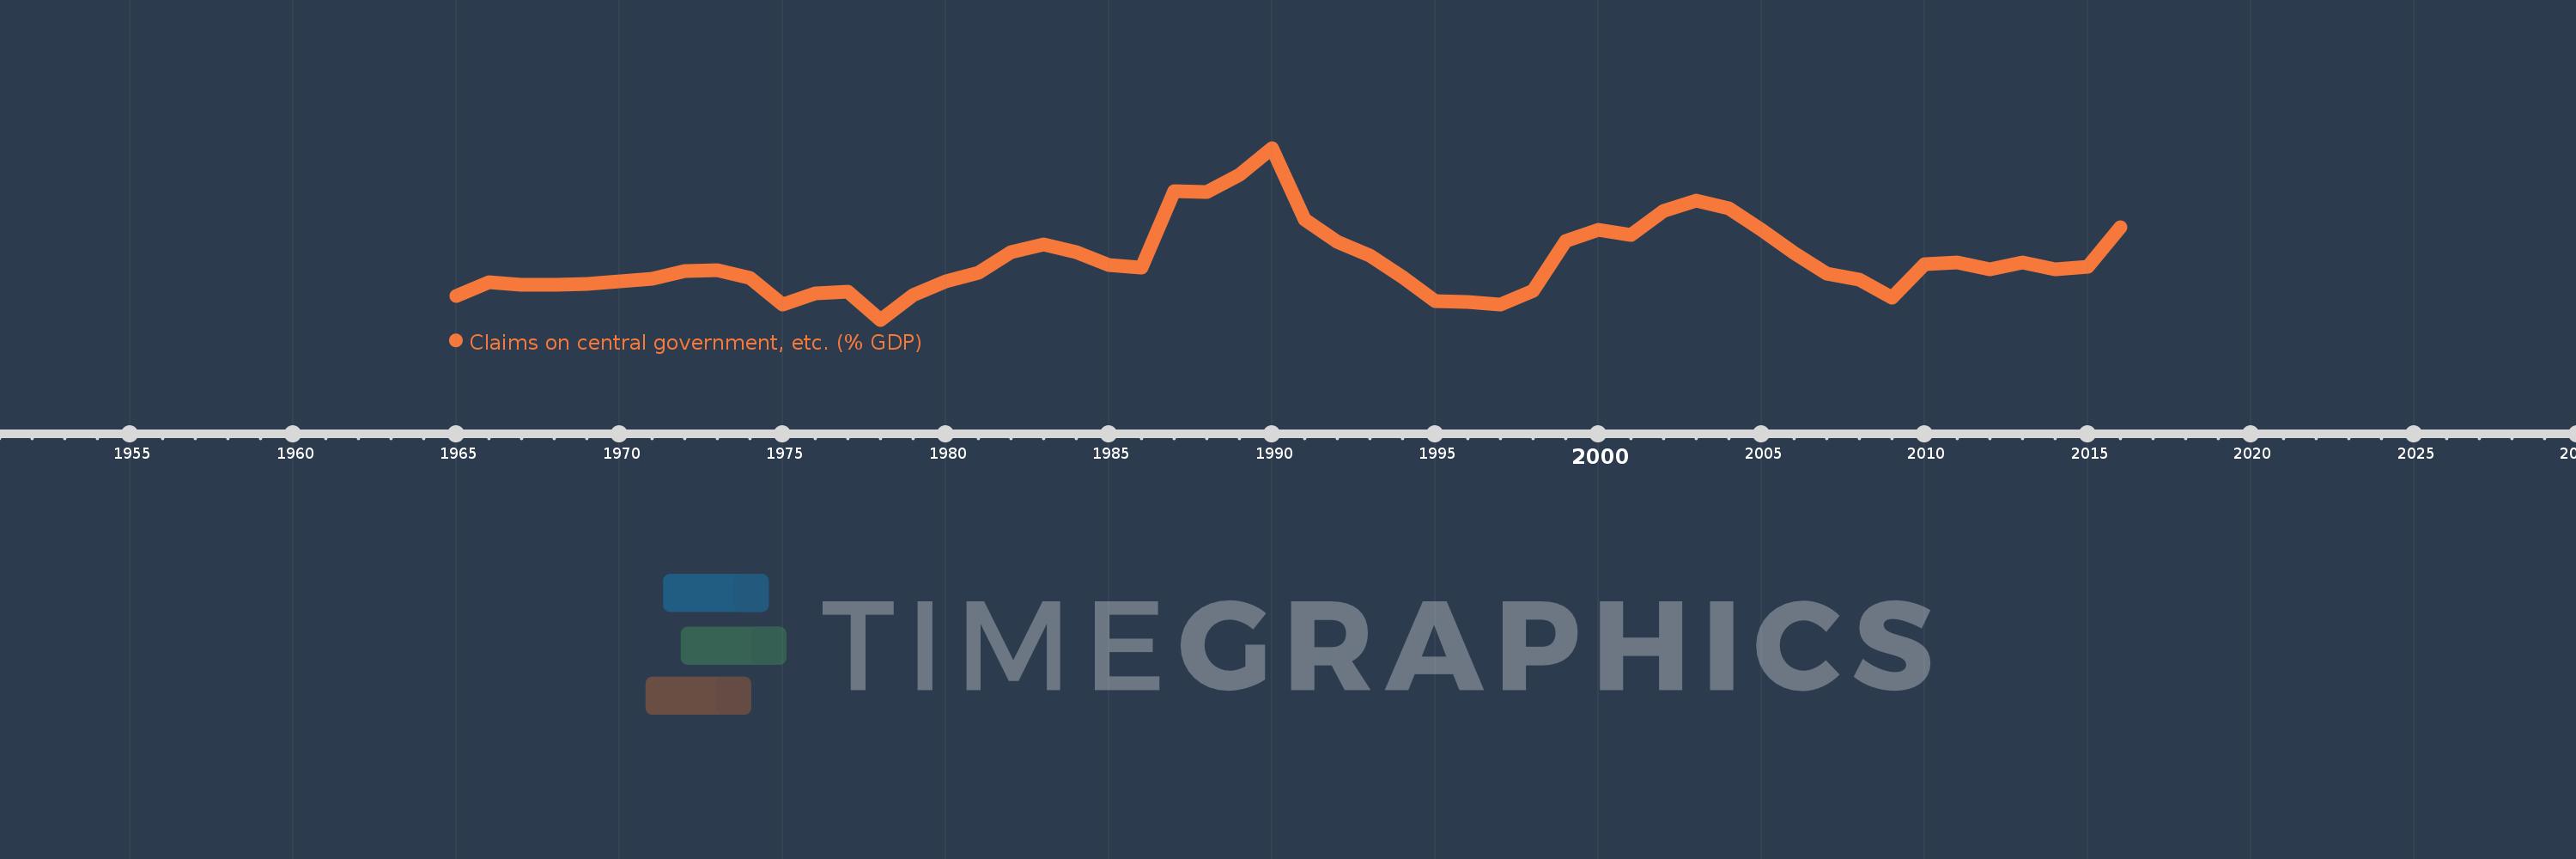
Claims on central government, etc. (% GDP)
2016,2015,2014,2013,2012,2011,2010,2009,2008,2007,2006,2005,2004,2003,2002,2001,2000,1999,1998,1997,1996,1995,1994,1993,1992,1991,1990,1989,1988,1987,1986,1985,1984,1983,1982,1981,1980,1979,1978,1977,1976,1975,1974,1973,1972,1971,1970,1969,1968,1967,1966,1965
This statistics in other country:
AfghanistanAlbaniaAlgeriaAngolaAntigua and BarbudaArab WorldArgentinaArmeniaArubaAustraliaAustriaAzerbaijanBahamas, TheBahrainBangladeshBarbadosBelarusBelgiumBelizeBeninBhutanBoliviaBosnia and HerzegovinaBotswanaBrazilBrunei DarussalamBulgariaBurkina FasoBurundiCabo VerdeCambodiaCameroonCanadaCaribbean small statesCentral African RepublicCentral Europe and the BalticsChadChileChinaColombiaComorosCongo, Dem. Rep.Congo, Rep.Costa RicaCote d'IvoireCroatiaCyprusCzech RepublicDenmarkDjiboutiDominicaDominican RepublicEarly-demographic dividendEast Asia & PacificEast Asia & Pacific (excluding high income)East Asia & Pacific (IDA & IBRD countries)EcuadorEgypt, Arab Rep.El SalvadorEquatorial GuineaEritreaEstoniaEthiopiaEuro areaEurope & Central AsiaEurope & Central Asia (excluding high income)Europe & Central Asia (IDA & IBRD countries)European UnionFijiFinlandFragile and conflict affected situationsFranceGabonGambia, TheGeorgiaGermanyGhanaGreeceGrenadaGuatemalaGuineaGuinea-BissauGuyanaHaitiHeavily indebted poor countries (HIPC)High incomeHondurasHong Kong SAR, ChinaHungaryIBRD onlyIcelandIDA & IBRD totalIDA blendIDA onlyIDA totalIndiaIndonesiaIran, Islamic Rep.IraqIrelandIsraelItalyJamaicaJapanJordanKazakhstanKenyaKorea, Rep.KosovoKuwaitKyrgyz RepublicLao PDRLate-demographic dividendLatin America & Caribbean Latin America & Caribbean (excluding high income)Latin America & the Caribbean (IDA & IBRD countries)LatviaLeast developed countries: UN classificationLebanonLesothoLiberiaLibyaLithuaniaLow & middle incomeLow incomeLower middle incomeLuxembourgMacao SAR, ChinaMacedonia, FYRMadagascarMalawiMalaysiaMaldivesMaliMaltaMauritaniaMauritiusMexicoMicronesia, Fed. Sts.Middle East & North AfricaMiddle East & North Africa (excluding high income)Middle East & North Africa (IDA & IBRD countries)Middle incomeMoldovaMongoliaMontenegroMoroccoMozambiqueMyanmarNamibiaNepalNetherlandsNew ZealandNicaraguaNigerNigeriaNorth AmericaNorwayOECD membersOmanOther small statesPacific island small statesPakistanPanamaPapua New GuineaParaguayPeruPhilippinesPolandPortugalPost-demographic dividendPre-demographic dividendQatarRomaniaRussian FederationRwandaSamoaSao Tome and PrincipeSaudi ArabiaSenegalSerbiaSeychellesSierra LeoneSingaporeSlovak RepublicSloveniaSmall statesSolomon IslandsSouth AfricaSouth AsiaSouth Asia (IDA & IBRD)South SudanSpainSri LankaSt. Kitts and NevisSt. LuciaSt. Vincent and the GrenadinesSub-Saharan Africa Sub-Saharan Africa (excluding high income)Sub-Saharan Africa (IDA & IBRD countries)SudanSurinameSwazilandSwedenSwitzerlandSyrian Arab RepublicTajikistanTanzaniaThailandTimor-LesteTogoTongaTrinidad and TobagoTunisiaTurkeyUgandaUkraineUnited Arab EmiratesUnited KingdomUnited StatesUpper middle incomeUruguayVanuatuVenezuela, RBVietnamWest Bank and GazaWorldYemen, Rep.ZambiaZimbabwe Timeline:
This timeline shows a graph from 1965 to 2016 of Low & middle income. No data until 1964. Number of actual observations by date: 52.
Source name:
World Development Indicators
Source organization:
International Monetary Fund, International Financial Statistics and data files, and World Bank and OECD GDP estimates.
Categories, topics:
Financial Sector
Last updated:
apr 23, 2017
Indicators value changes by year
Maximum:
21.523
jan 1, 1990
At the date of observation
Value
Absolute change
Change from previous value
jan 1, 1965
8.034
+8.034
0.0%
jan 1, 1966
9.256
+1.222
15.21%
jan 1, 1967
9.057
-0.199
-2.15%
jan 1, 1968
9.092
+0.035
0.39%
jan 1, 1969
9.148
+0.056
0.61%
jan 1, 1970
9.385
+0.237
2.59%
jan 1, 1971
9.624
+0.239
2.54%
jan 1, 1972
10.323
+0.699
7.26%
jan 1, 1973
10.373
+0.05
0.49%
jan 1, 1974
9.704
-0.669
-6.45%
jan 1, 1975
7.284
-2.419
-24.93%
jan 1, 1976
8.292
+1.007
13.83%
jan 1, 1977
8.404
+0.112
1.35%
jan 1, 1978
5.872
-2.532
-30.13%
jan 1, 1979
8.156
+2.284
38.89%
jan 1, 1980
9.331
+1.175
14.41%
jan 1, 1981
10.154
+0.823
8.83%
jan 1, 1982
12.012
+1.858
18.29%
jan 1, 1983
12.75
+0.737
6.14%
jan 1, 1984
12.066
-0.683
-5.36%
jan 1, 1985
10.888
-1.178
-9.76%
jan 1, 1986
10.643
-0.246
-2.26%
jan 1, 1987
17.573
+6.93
65.11%
jan 1, 1988
17.541
-0.032
-0.18%
jan 1, 1989
19.044
+1.503
8.57%
jan 1, 1990
21.523
+2.479
13.02%
jan 1, 1991
15.014
-6.509
-30.24%
jan 1, 1992
12.967
-2.047
-13.64%
jan 1, 1993
11.733
-1.234
-9.52%
jan 1, 1994
9.765
-1.968
-16.77%
jan 1, 1995
7.551
-2.214
-22.67%
jan 1, 1996
7.468
-0.083
-1.1%
jan 1, 1997
7.244
-0.224
-3.01%
jan 1, 1998
8.483
+1.24
17.11%
jan 1, 1999
13.043
+4.56
53.75%
jan 1, 2000
14.039
+0.996
7.64%
jan 1, 2001
13.584
-0.455
-3.24%
jan 1, 2002
15.763
+2.179
16.04%
jan 1, 2003
16.758
+0.995
6.31%
jan 1, 2004
16.008
-0.75
-4.48%
jan 1, 2005
14.066
-1.941
-12.13%
jan 1, 2006
11.952
-2.114
-15.03%
jan 1, 2007
10.062
-1.89
-15.81%
jan 1, 2008
9.551
-0.511
-5.08%
jan 1, 2009
7.856
-1.695
-17.75%
jan 1, 2010
10.948
+3.091
39.35%
jan 1, 2011
11.086
+0.139
1.27%
jan 1, 2012
10.493
-0.593
-5.35%
jan 1, 2013
11.116
+0.623
5.94%
jan 1, 2014
10.464
-0.652
-5.87%
jan 1, 2015
10.724
+0.26
2.49%
jan 1, 2016
14.338
+3.614
33.7%
Ranking of countries by current statistics by years


Comments: