29
/
en
AIzaSyAYiBZKx7MnpbEhh9jyipgxe19OcubqV5w
April 1, 2024
30506
Europe & Central Asia
ECS
false
2
1
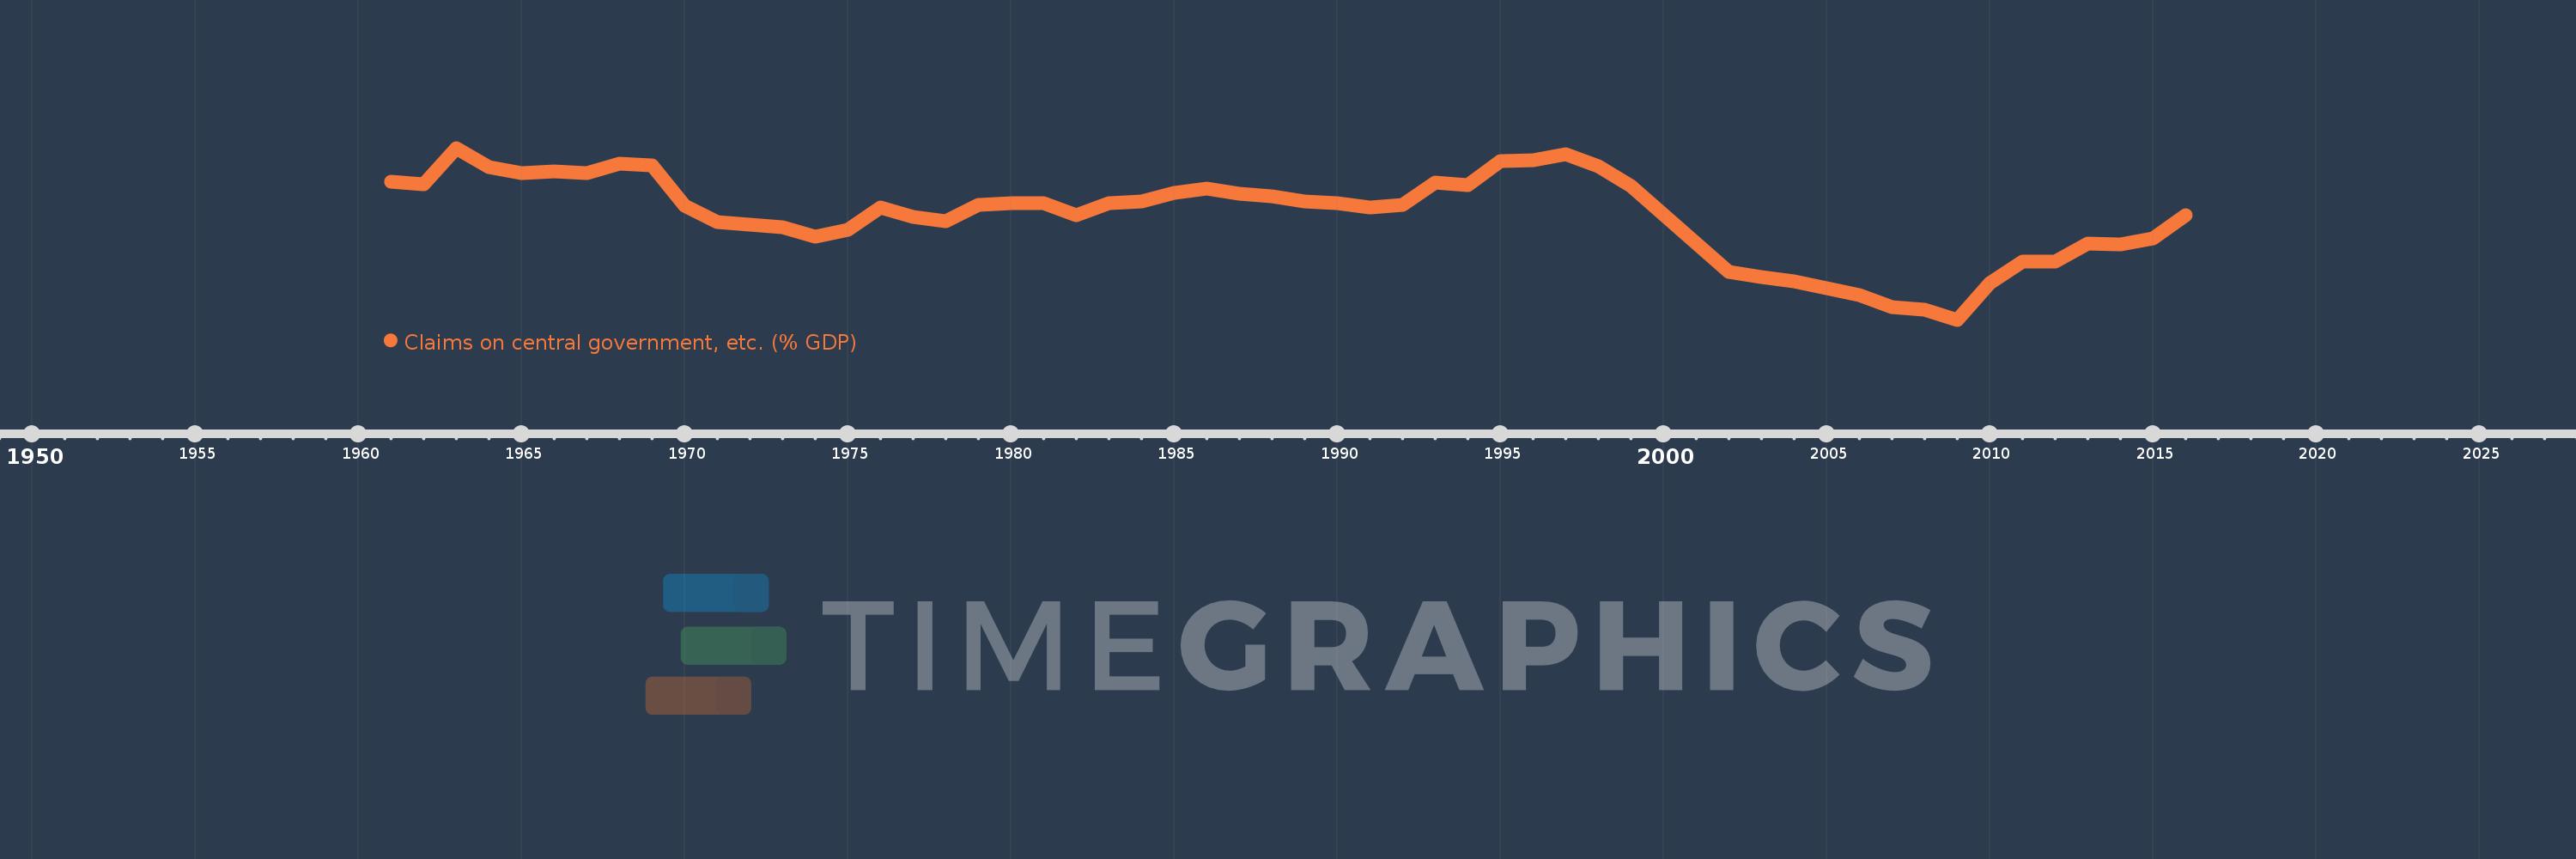
Claims on central government, etc. (% GDP)
2016,2015,2014,2013,2012,2011,2010,2009,2008,2007,2006,2005,2004,2003,2002,1999,1998,1997,1996,1995,1994,1993,1992,1991,1990,1989,1988,1987,1986,1985,1984,1983,1982,1981,1980,1979,1978,1977,1976,1975,1974,1973,1972,1971,1970,1969,1968,1967,1966,1965,1964,1963,1962,1961
This statistics in other country:
AfghanistanAlbaniaAlgeriaAngolaAntigua and BarbudaArab WorldArgentinaArmeniaArubaAustraliaAustriaAzerbaijanBahamas, TheBahrainBangladeshBarbadosBelarusBelgiumBelizeBeninBhutanBoliviaBosnia and HerzegovinaBotswanaBrazilBrunei DarussalamBulgariaBurkina FasoBurundiCabo VerdeCambodiaCameroonCanadaCaribbean small statesCentral African RepublicCentral Europe and the BalticsChadChileChinaColombiaComorosCongo, Dem. Rep.Congo, Rep.Costa RicaCote d'IvoireCroatiaCyprusCzech RepublicDenmarkDjiboutiDominicaDominican RepublicEarly-demographic dividendEast Asia & PacificEast Asia & Pacific (excluding high income)East Asia & Pacific (IDA & IBRD countries)EcuadorEgypt, Arab Rep.El SalvadorEquatorial GuineaEritreaEstoniaEthiopiaEuro areaEurope & Central AsiaEurope & Central Asia (excluding high income)Europe & Central Asia (IDA & IBRD countries)European UnionFijiFinlandFragile and conflict affected situationsFranceGabonGambia, TheGeorgiaGermanyGhanaGreeceGrenadaGuatemalaGuineaGuinea-BissauGuyanaHaitiHeavily indebted poor countries (HIPC)High incomeHondurasHong Kong SAR, ChinaHungaryIBRD onlyIcelandIDA & IBRD totalIDA blendIDA onlyIDA totalIndiaIndonesiaIran, Islamic Rep.IraqIrelandIsraelItalyJamaicaJapanJordanKazakhstanKenyaKorea, Rep.KosovoKuwaitKyrgyz RepublicLao PDRLate-demographic dividendLatin America & Caribbean Latin America & Caribbean (excluding high income)Latin America & the Caribbean (IDA & IBRD countries)LatviaLeast developed countries: UN classificationLebanonLesothoLiberiaLibyaLithuaniaLow & middle incomeLow incomeLower middle incomeLuxembourgMacao SAR, ChinaMacedonia, FYRMadagascarMalawiMalaysiaMaldivesMaliMaltaMauritaniaMauritiusMexicoMicronesia, Fed. Sts.Middle East & North AfricaMiddle East & North Africa (excluding high income)Middle East & North Africa (IDA & IBRD countries)Middle incomeMoldovaMongoliaMontenegroMoroccoMozambiqueMyanmarNamibiaNepalNetherlandsNew ZealandNicaraguaNigerNigeriaNorth AmericaNorwayOECD membersOmanOther small statesPacific island small statesPakistanPanamaPapua New GuineaParaguayPeruPhilippinesPolandPortugalPost-demographic dividendPre-demographic dividendQatarRomaniaRussian FederationRwandaSamoaSao Tome and PrincipeSaudi ArabiaSenegalSerbiaSeychellesSierra LeoneSingaporeSlovak RepublicSloveniaSmall statesSolomon IslandsSouth AfricaSouth AsiaSouth Asia (IDA & IBRD)South SudanSpainSri LankaSt. Kitts and NevisSt. LuciaSt. Vincent and the GrenadinesSub-Saharan Africa Sub-Saharan Africa (excluding high income)Sub-Saharan Africa (IDA & IBRD countries)SudanSurinameSwazilandSwedenSwitzerlandSyrian Arab RepublicTajikistanTanzaniaThailandTimor-LesteTogoTongaTrinidad and TobagoTunisiaTurkeyUgandaUkraineUnited Arab EmiratesUnited KingdomUnited StatesUpper middle incomeUruguayVanuatuVenezuela, RBVietnamWest Bank and GazaWorldYemen, Rep.ZambiaZimbabwe Timeline:
This timeline shows a graph from 1961 to 2016 of Europe & Central Asia. No data until 1960. Number of actual observations by date: 54.
Source name:
World Development Indicators
Source organization:
International Monetary Fund, International Financial Statistics and data files, and World Bank and OECD GDP estimates.
Categories, topics:
Financial Sector
Last updated:
apr 23, 2017
Indicators value changes by year
Maximum:
21.294
jan 1, 1963
At the date of observation
Value
Absolute change
Change from previous value
jan 1, 1961
17.726
+17.726
0.0%
jan 1, 1962
17.437
-0.289
-1.63%
jan 1, 1963
21.294
+3.857
22.12%
jan 1, 1964
19.306
-1.988
-9.34%
jan 1, 1965
18.616
-0.69
-3.57%
jan 1, 1966
18.802
+0.186
1.0%
jan 1, 1967
18.596
-0.206
-1.09%
jan 1, 1968
19.652
+1.056
5.68%
jan 1, 1969
19.409
-0.243
-1.24%
jan 1, 1970
15.16
-4.248
-21.89%
jan 1, 1971
13.455
-1.706
-11.25%
jan 1, 1972
13.192
-0.263
-1.95%
jan 1, 1973
12.918
-0.274
-2.08%
jan 1, 1974
11.952
-0.965
-7.47%
jan 1, 1975
12.602
+0.649
5.43%
jan 1, 1976
14.961
+2.36
18.72%
jan 1, 1977
14.024
-0.937
-6.27%
jan 1, 1978
13.585
-0.439
-3.13%
jan 1, 1979
15.309
+1.723
12.69%
jan 1, 1980
15.444
+0.136
0.89%
jan 1, 1981
15.465
+0.021
0.13%
jan 1, 1982
14.214
-1.251
-8.09%
jan 1, 1983
15.483
+1.269
8.93%
jan 1, 1984
15.623
+0.14
0.9%
jan 1, 1985
16.534
+0.911
5.83%
jan 1, 1986
16.999
+0.464
2.81%
jan 1, 1987
16.488
-0.511
-3.01%
jan 1, 1988
16.168
-0.32
-1.94%
jan 1, 1989
15.654
-0.513
-3.18%
jan 1, 1990
15.425
-0.23
-1.47%
jan 1, 1991
14.957
-0.468
-3.03%
jan 1, 1992
15.291
+0.335
2.24%
jan 1, 1993
17.599
+2.307
15.09%
jan 1, 1994
17.391
-0.207
-1.18%
jan 1, 1995
19.889
+2.497
14.36%
jan 1, 1996
19.979
+0.09
0.45%
jan 1, 1997
20.645
+0.665
3.33%
jan 1, 1998
19.393
-1.252
-6.06%
jan 1, 1999
17.227
-2.166
-11.17%
jan 1, 2002
8.225
-9.002
-52.26%
jan 1, 2003
7.645
-0.58
-7.05%
jan 1, 2004
7.222
-0.423
-5.53%
jan 1, 2005
6.507
-0.714
-9.89%
jan 1, 2006
5.704
-0.804
-12.35%
jan 1, 2007
4.475
-1.228
-21.53%
jan 1, 2008
4.213
-0.262
-5.86%
jan 1, 2009
3.135
-1.078
-25.58%
jan 1, 2010
7.012
+3.877
123.64%
jan 1, 2011
9.257
+2.245
32.02%
jan 1, 2012
9.25
-0.008
-0.08%
jan 1, 2013
11.183
+1.933
20.9%
jan 1, 2014
11.076
-0.107
-0.96%
jan 1, 2015
11.755
+0.679
6.13%
jan 1, 2016
14.143
+2.388
20.31%
Ranking of countries by current statistics by years


Comments: