29
/
en
AIzaSyAYiBZKx7MnpbEhh9jyipgxe19OcubqV5w
April 1, 2024
51708
North America
NAC
false
2
1
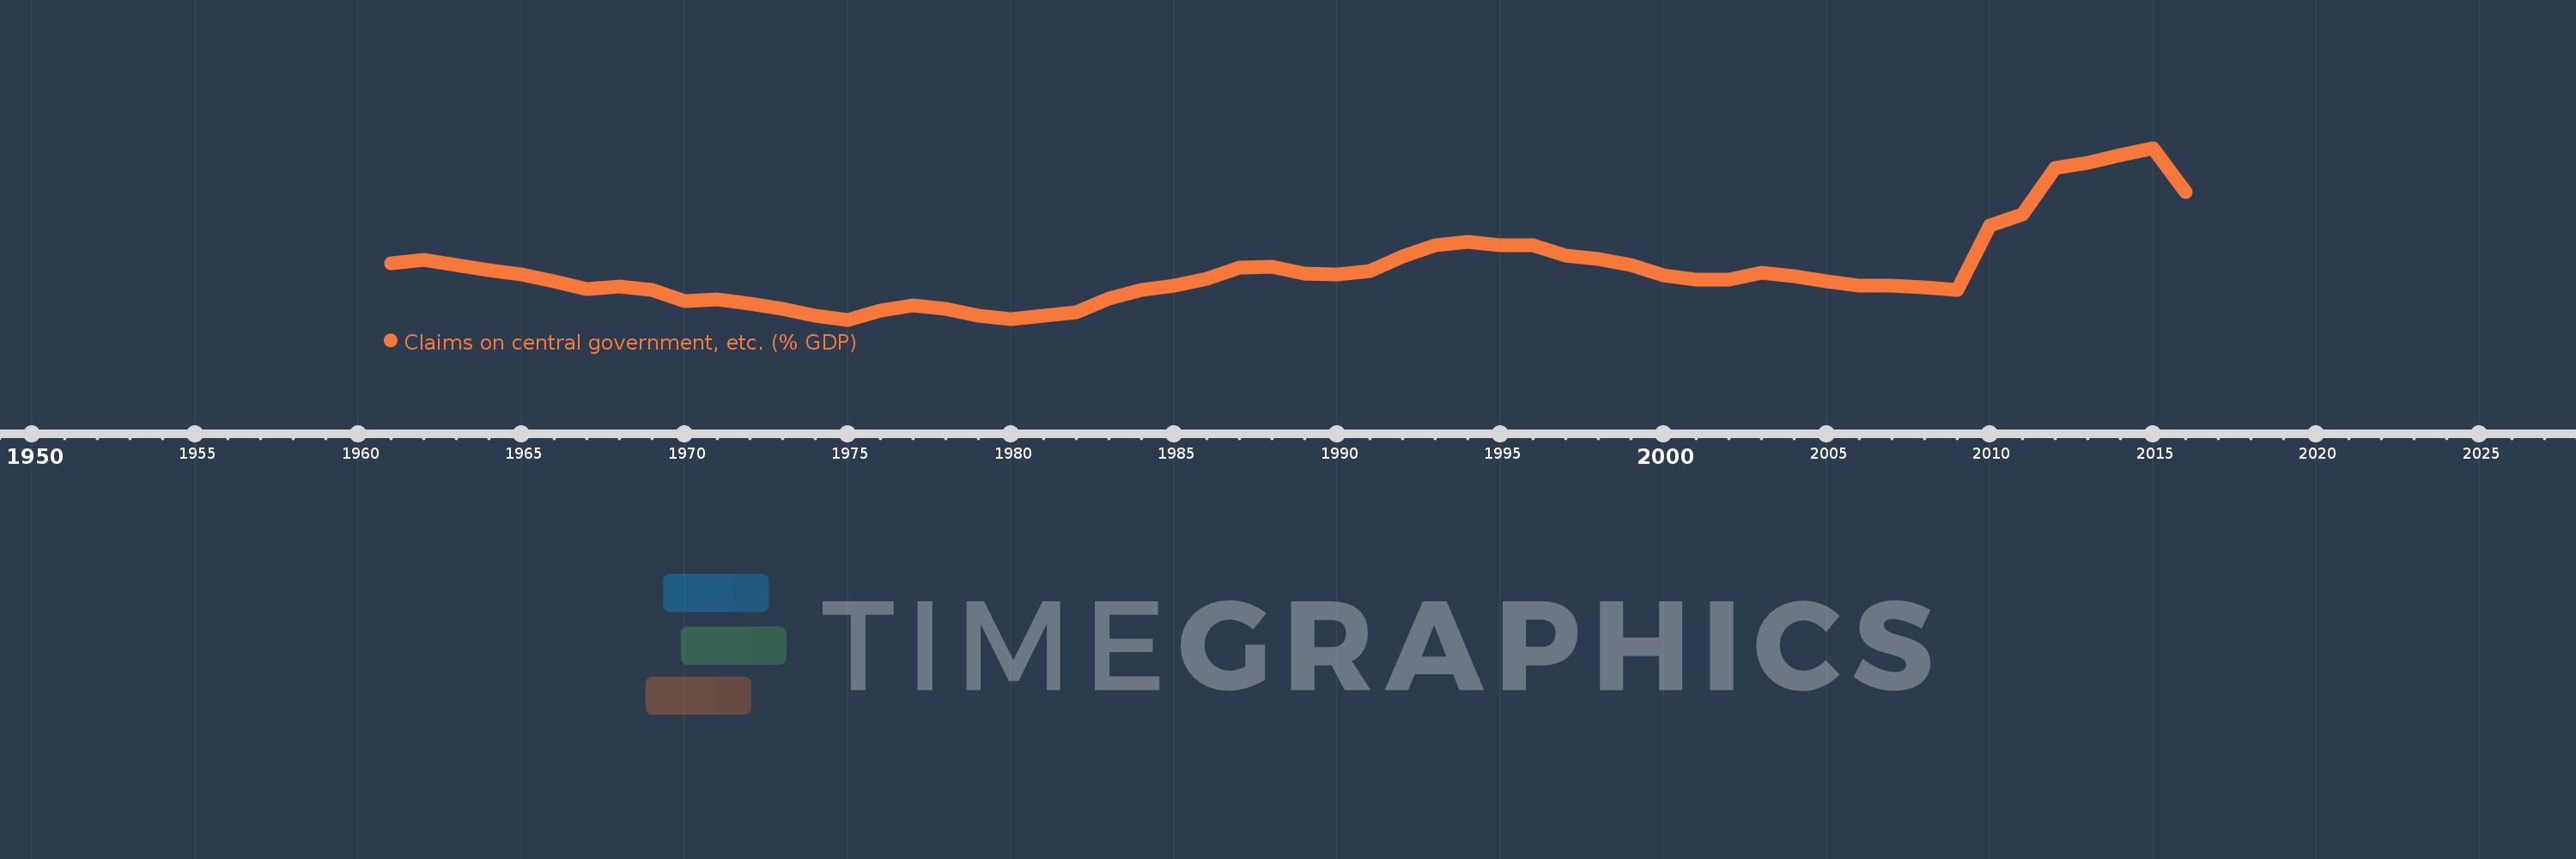
Claims on central government, etc. (% GDP)
2016,2015,2014,2013,2012,2011,2010,2009,2008,2007,2006,2005,2004,2003,2002,2001,2000,1999,1998,1997,1996,1995,1994,1993,1992,1991,1990,1989,1988,1987,1986,1985,1984,1983,1982,1981,1980,1979,1978,1977,1976,1975,1974,1973,1972,1971,1970,1969,1968,1967,1966,1965,1964,1963,1962,1961
This statistics in other country:
AfghanistanAlbaniaAlgeriaAngolaAntigua and BarbudaArab WorldArgentinaArmeniaArubaAustraliaAustriaAzerbaijanBahamas, TheBahrainBangladeshBarbadosBelarusBelgiumBelizeBeninBhutanBoliviaBosnia and HerzegovinaBotswanaBrazilBrunei DarussalamBulgariaBurkina FasoBurundiCabo VerdeCambodiaCameroonCanadaCaribbean small statesCentral African RepublicCentral Europe and the BalticsChadChileChinaColombiaComorosCongo, Dem. Rep.Congo, Rep.Costa RicaCote d'IvoireCroatiaCyprusCzech RepublicDenmarkDjiboutiDominicaDominican RepublicEarly-demographic dividendEast Asia & PacificEast Asia & Pacific (excluding high income)East Asia & Pacific (IDA & IBRD countries)EcuadorEgypt, Arab Rep.El SalvadorEquatorial GuineaEritreaEstoniaEthiopiaEuro areaEurope & Central AsiaEurope & Central Asia (excluding high income)Europe & Central Asia (IDA & IBRD countries)European UnionFijiFinlandFragile and conflict affected situationsFranceGabonGambia, TheGeorgiaGermanyGhanaGreeceGrenadaGuatemalaGuineaGuinea-BissauGuyanaHaitiHeavily indebted poor countries (HIPC)High incomeHondurasHong Kong SAR, ChinaHungaryIBRD onlyIcelandIDA & IBRD totalIDA blendIDA onlyIDA totalIndiaIndonesiaIran, Islamic Rep.IraqIrelandIsraelItalyJamaicaJapanJordanKazakhstanKenyaKorea, Rep.KosovoKuwaitKyrgyz RepublicLao PDRLate-demographic dividendLatin America & Caribbean Latin America & Caribbean (excluding high income)Latin America & the Caribbean (IDA & IBRD countries)LatviaLeast developed countries: UN classificationLebanonLesothoLiberiaLibyaLithuaniaLow & middle incomeLow incomeLower middle incomeLuxembourgMacao SAR, ChinaMacedonia, FYRMadagascarMalawiMalaysiaMaldivesMaliMaltaMauritaniaMauritiusMexicoMicronesia, Fed. Sts.Middle East & North AfricaMiddle East & North Africa (excluding high income)Middle East & North Africa (IDA & IBRD countries)Middle incomeMoldovaMongoliaMontenegroMoroccoMozambiqueMyanmarNamibiaNepalNetherlandsNew ZealandNicaraguaNigerNigeriaNorth AmericaNorwayOECD membersOmanOther small statesPacific island small statesPakistanPanamaPapua New GuineaParaguayPeruPhilippinesPolandPortugalPost-demographic dividendPre-demographic dividendQatarRomaniaRussian FederationRwandaSamoaSao Tome and PrincipeSaudi ArabiaSenegalSerbiaSeychellesSierra LeoneSingaporeSlovak RepublicSloveniaSmall statesSolomon IslandsSouth AfricaSouth AsiaSouth Asia (IDA & IBRD)South SudanSpainSri LankaSt. Kitts and NevisSt. LuciaSt. Vincent and the GrenadinesSub-Saharan Africa Sub-Saharan Africa (excluding high income)Sub-Saharan Africa (IDA & IBRD countries)SudanSurinameSwazilandSwedenSwitzerlandSyrian Arab RepublicTajikistanTanzaniaThailandTimor-LesteTogoTongaTrinidad and TobagoTunisiaTurkeyUgandaUkraineUnited Arab EmiratesUnited KingdomUnited StatesUpper middle incomeUruguayVanuatuVenezuela, RBVietnamWest Bank and GazaWorldYemen, Rep.ZambiaZimbabwe Timeline:
This timeline shows a graph from 1961 to 2016 of North America. No data until 1960. Number of actual observations by date: 56.
Source name:
World Development Indicators
Source organization:
International Monetary Fund, International Financial Statistics and data files, and World Bank and OECD GDP estimates.
Categories, topics:
Financial Sector
Last updated:
apr 23, 2017
Indicators value changes by year
Minimum:
11.999
jan 1, 1975
Maximum:
44.784
jan 1, 2015
At the date of observation
Value
Absolute change
Change from previous value
jan 1, 1961
22.693
+22.693
0.0%
jan 1, 1962
23.436
+0.743
3.27%
jan 1, 1963
22.376
-1.059
-4.52%
jan 1, 1964
21.413
-0.963
-4.31%
jan 1, 1965
20.615
-0.798
-3.73%
jan 1, 1966
19.302
-1.313
-6.37%
jan 1, 1967
17.873
-1.429
-7.4%
jan 1, 1968
18.356
+0.482
2.7%
jan 1, 1969
17.678
-0.677
-3.69%
jan 1, 1970
15.576
-2.102
-11.89%
jan 1, 1971
15.847
+0.271
1.74%
jan 1, 1972
15.116
-0.731
-4.61%
jan 1, 1973
14.129
-0.987
-6.53%
jan 1, 1974
12.769
-1.36
-9.62%
jan 1, 1975
11.999
-0.77
-6.03%
jan 1, 1976
13.781
+1.781
14.85%
jan 1, 1977
14.721
+0.94
6.82%
jan 1, 1978
14.01
-0.71
-4.82%
jan 1, 1979
12.709
-1.301
-9.29%
jan 1, 1980
12.131
-0.579
-4.55%
jan 1, 1981
12.815
+0.685
5.64%
jan 1, 1982
13.356
+0.54
4.22%
jan 1, 1983
16.007
+2.651
19.85%
jan 1, 1984
17.725
+1.718
10.73%
jan 1, 1985
18.438
+0.713
4.02%
jan 1, 1986
19.739
+1.301
7.06%
jan 1, 1987
21.917
+2.178
11.03%
jan 1, 1988
22.165
+0.248
1.13%
jan 1, 1989
20.772
-1.393
-6.28%
jan 1, 1990
20.634
-0.138
-0.67%
jan 1, 1991
21.302
+0.668
3.24%
jan 1, 1992
24.099
+2.797
13.13%
jan 1, 1993
26.175
+2.076
8.62%
jan 1, 1994
26.906
+0.73
2.79%
jan 1, 1995
26.25
-0.656
-2.44%
jan 1, 1996
26.239
-0.011
-0.04%
jan 1, 1997
24.226
-2.012
-7.67%
jan 1, 1998
23.588
-0.639
-2.64%
jan 1, 1999
22.5
-1.087
-4.61%
jan 1, 2000
20.438
-2.063
-9.17%
jan 1, 2001
19.626
-0.812
-3.97%
jan 1, 2002
19.583
-0.043
-0.22%
jan 1, 2003
20.917
+1.334
6.81%
jan 1, 2004
20.347
-0.57
-2.72%
jan 1, 2005
19.256
-1.091
-5.36%
jan 1, 2006
18.579
-0.677
-3.52%
jan 1, 2007
18.515
-0.064
-0.35%
jan 1, 2008
18.109
-0.406
-2.19%
jan 1, 2009
17.608
-0.501
-2.77%
jan 1, 2010
30.026
+12.419
70.53%
jan 1, 2011
32.032
+2.006
6.68%
jan 1, 2012
40.911
+8.879
27.72%
jan 1, 2013
41.888
+0.977
2.39%
jan 1, 2014
43.349
+1.461
3.49%
jan 1, 2015
44.784
+1.435
3.31%
jan 1, 2016
36.367
-8.417
-18.79%
Ranking of countries by current statistics by years


Comments: