29
/
en
AIzaSyAYiBZKx7MnpbEhh9jyipgxe19OcubqV5w
April 1, 2024
73709
Austria
AUT
true
2
1
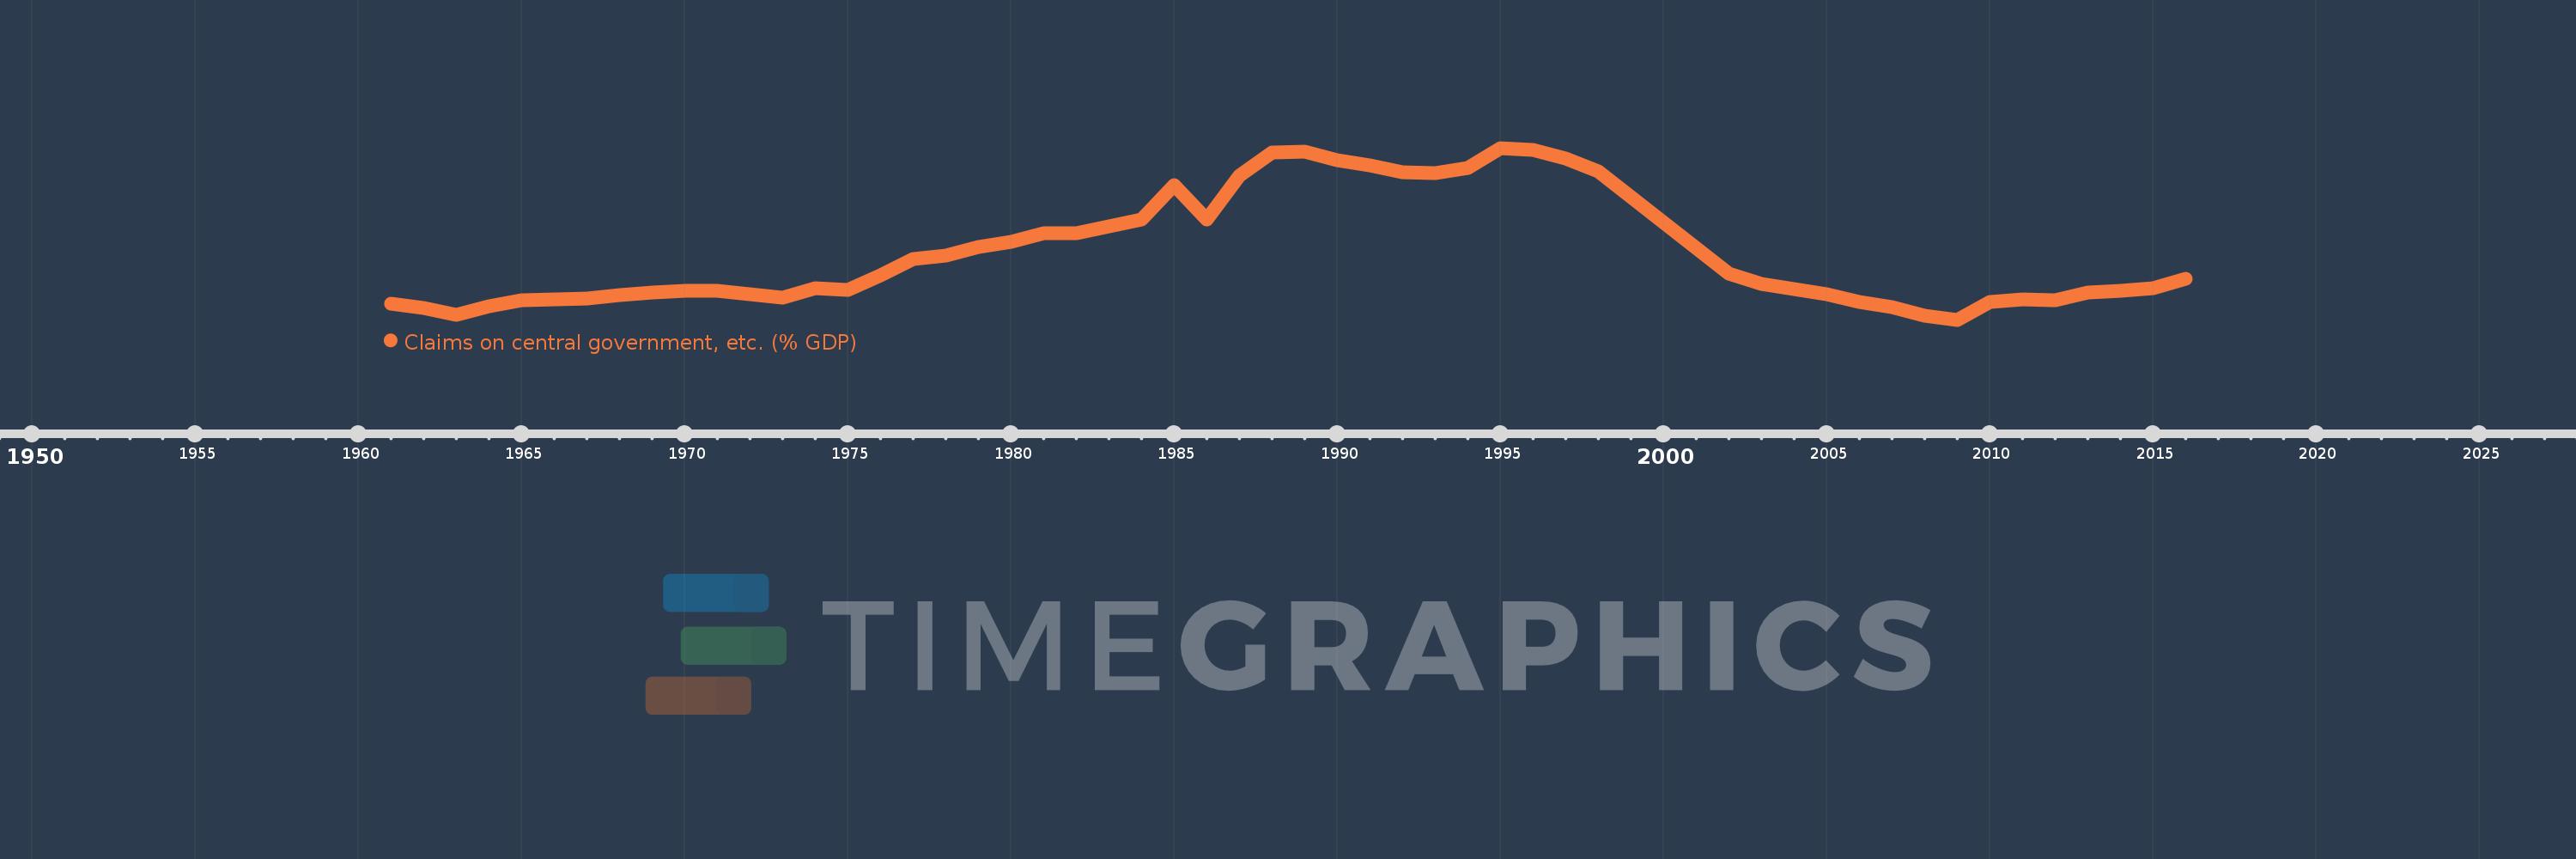
Claims on central government, etc. (% GDP)
2016,2015,2014,2013,2012,2011,2010,2009,2008,2007,2006,2005,2004,2003,2002,1998,1997,1996,1995,1994,1993,1992,1991,1990,1989,1988,1987,1986,1985,1984,1983,1982,1981,1980,1979,1978,1977,1976,1975,1974,1973,1972,1971,1970,1969,1968,1967,1966,1965,1964,1963,1962,1961
This statistics in other country:
AfghanistanAlbaniaAlgeriaAngolaAntigua and BarbudaArab WorldArgentinaArmeniaArubaAustraliaAustriaAzerbaijanBahamas, TheBahrainBangladeshBarbadosBelarusBelgiumBelizeBeninBhutanBoliviaBosnia and HerzegovinaBotswanaBrazilBrunei DarussalamBulgariaBurkina FasoBurundiCabo VerdeCambodiaCameroonCanadaCaribbean small statesCentral African RepublicCentral Europe and the BalticsChadChileChinaColombiaComorosCongo, Dem. Rep.Congo, Rep.Costa RicaCote d'IvoireCroatiaCyprusCzech RepublicDenmarkDjiboutiDominicaDominican RepublicEarly-demographic dividendEast Asia & PacificEast Asia & Pacific (excluding high income)East Asia & Pacific (IDA & IBRD countries)EcuadorEgypt, Arab Rep.El SalvadorEquatorial GuineaEritreaEstoniaEthiopiaEuro areaEurope & Central AsiaEurope & Central Asia (excluding high income)Europe & Central Asia (IDA & IBRD countries)European UnionFijiFinlandFragile and conflict affected situationsFranceGabonGambia, TheGeorgiaGermanyGhanaGreeceGrenadaGuatemalaGuineaGuinea-BissauGuyanaHaitiHeavily indebted poor countries (HIPC)High incomeHondurasHong Kong SAR, ChinaHungaryIBRD onlyIcelandIDA & IBRD totalIDA blendIDA onlyIDA totalIndiaIndonesiaIran, Islamic Rep.IraqIrelandIsraelItalyJamaicaJapanJordanKazakhstanKenyaKorea, Rep.KosovoKuwaitKyrgyz RepublicLao PDRLate-demographic dividendLatin America & Caribbean Latin America & Caribbean (excluding high income)Latin America & the Caribbean (IDA & IBRD countries)LatviaLeast developed countries: UN classificationLebanonLesothoLiberiaLibyaLithuaniaLow & middle incomeLow incomeLower middle incomeLuxembourgMacao SAR, ChinaMacedonia, FYRMadagascarMalawiMalaysiaMaldivesMaliMaltaMauritaniaMauritiusMexicoMicronesia, Fed. Sts.Middle East & North AfricaMiddle East & North Africa (excluding high income)Middle East & North Africa (IDA & IBRD countries)Middle incomeMoldovaMongoliaMontenegroMoroccoMozambiqueMyanmarNamibiaNepalNetherlandsNew ZealandNicaraguaNigerNigeriaNorth AmericaNorwayOECD membersOmanOther small statesPacific island small statesPakistanPanamaPapua New GuineaParaguayPeruPhilippinesPolandPortugalPost-demographic dividendPre-demographic dividendQatarRomaniaRussian FederationRwandaSamoaSao Tome and PrincipeSaudi ArabiaSenegalSerbiaSeychellesSierra LeoneSingaporeSlovak RepublicSloveniaSmall statesSolomon IslandsSouth AfricaSouth AsiaSouth Asia (IDA & IBRD)South SudanSpainSri LankaSt. Kitts and NevisSt. LuciaSt. Vincent and the GrenadinesSub-Saharan Africa Sub-Saharan Africa (excluding high income)Sub-Saharan Africa (IDA & IBRD countries)SudanSurinameSwazilandSwedenSwitzerlandSyrian Arab RepublicTajikistanTanzaniaThailandTimor-LesteTogoTongaTrinidad and TobagoTunisiaTurkeyUgandaUkraineUnited Arab EmiratesUnited KingdomUnited StatesUpper middle incomeUruguayVanuatuVenezuela, RBVietnamWest Bank and GazaWorldYemen, Rep.ZambiaZimbabwe Timeline:
This timeline shows a graph from 1961 to 2016 of Austria. No data until 1960. Number of actual observations by date: 53.
Source name:
World Development Indicators
Source organization:
International Monetary Fund, International Financial Statistics and data files, and World Bank and OECD GDP estimates.
Categories, topics:
Financial Sector
Last updated:
apr 23, 2017
Indicators value changes by year
Maximum:
31.947
jan 1, 1995
At the date of observation
Value
Absolute change
Change from previous value
jan 1, 1961
5.464
+5.464
0.0%
jan 1, 1962
4.683
-0.781
-14.3%
jan 1, 1963
3.501
-1.181
-25.23%
jan 1, 1964
5.015
+1.513
43.21%
jan 1, 1965
6.002
+0.987
19.68%
jan 1, 1966
6.134
+0.132
2.21%
jan 1, 1967
6.306
+0.172
2.8%
jan 1, 1968
6.913
+0.607
9.62%
jan 1, 1969
7.403
+0.49
7.09%
jan 1, 1970
7.698
+0.294
3.98%
jan 1, 1971
7.644
-0.054
-0.7%
jan 1, 1972
7.031
-0.613
-8.02%
jan 1, 1973
6.535
-0.495
-7.05%
jan 1, 1974
8.087
+1.551
23.74%
jan 1, 1975
7.769
-0.318
-3.93%
jan 1, 1976
10.356
+2.588
33.31%
jan 1, 1977
13.058
+2.702
26.09%
jan 1, 1978
13.681
+0.623
4.77%
jan 1, 1979
15.044
+1.362
9.96%
jan 1, 1980
16.005
+0.961
6.39%
jan 1, 1981
17.457
+1.452
9.07%
jan 1, 1982
17.421
-0.036
-0.21%
jan 1, 1983
18.682
+1.26
7.23%
jan 1, 1984
19.831
+1.149
6.15%
jan 1, 1985
25.666
+5.835
29.42%
jan 1, 1986
19.734
-5.932
-23.11%
jan 1, 1987
27.162
+7.429
37.64%
jan 1, 1988
31.205
+4.043
14.88%
jan 1, 1989
31.267
+0.061
0.2%
jan 1, 1990
29.886
-1.38
-4.41%
jan 1, 1991
29.019
-0.867
-2.9%
jan 1, 1992
27.803
-1.216
-4.19%
jan 1, 1993
27.625
-0.177
-0.64%
jan 1, 1994
28.54
+0.915
3.31%
jan 1, 1995
31.947
+3.407
11.94%
jan 1, 1996
31.557
-0.39
-1.22%
jan 1, 1997
30.183
-1.374
-4.35%
jan 1, 1998
27.983
-2.201
-7.29%
jan 1, 2002
10.542
-17.441
-62.33%
jan 1, 2003
8.782
-1.76
-16.69%
jan 1, 2004
7.97
-0.812
-9.25%
jan 1, 2005
7.011
-0.96
-12.04%
jan 1, 2006
5.798
-1.212
-17.29%
jan 1, 2007
4.929
-0.869
-14.99%
jan 1, 2008
3.472
-1.457
-29.56%
jan 1, 2009
2.74
-0.732
-21.08%
jan 1, 2010
5.757
+3.017
110.11%
jan 1, 2011
6.195
+0.438
7.6%
jan 1, 2012
6.058
-0.137
-2.2%
jan 1, 2013
7.317
+1.259
20.78%
jan 1, 2014
7.722
+0.405
5.53%
jan 1, 2015
8.112
+0.39
5.05%
jan 1, 2016
9.697
+1.585
19.54%
Ranking of countries by current statistics by years


Comments: