29
/
en
AIzaSyAYiBZKx7MnpbEhh9jyipgxe19OcubqV5w
April 1, 2024
106976
Colombia
COL
true
2
1
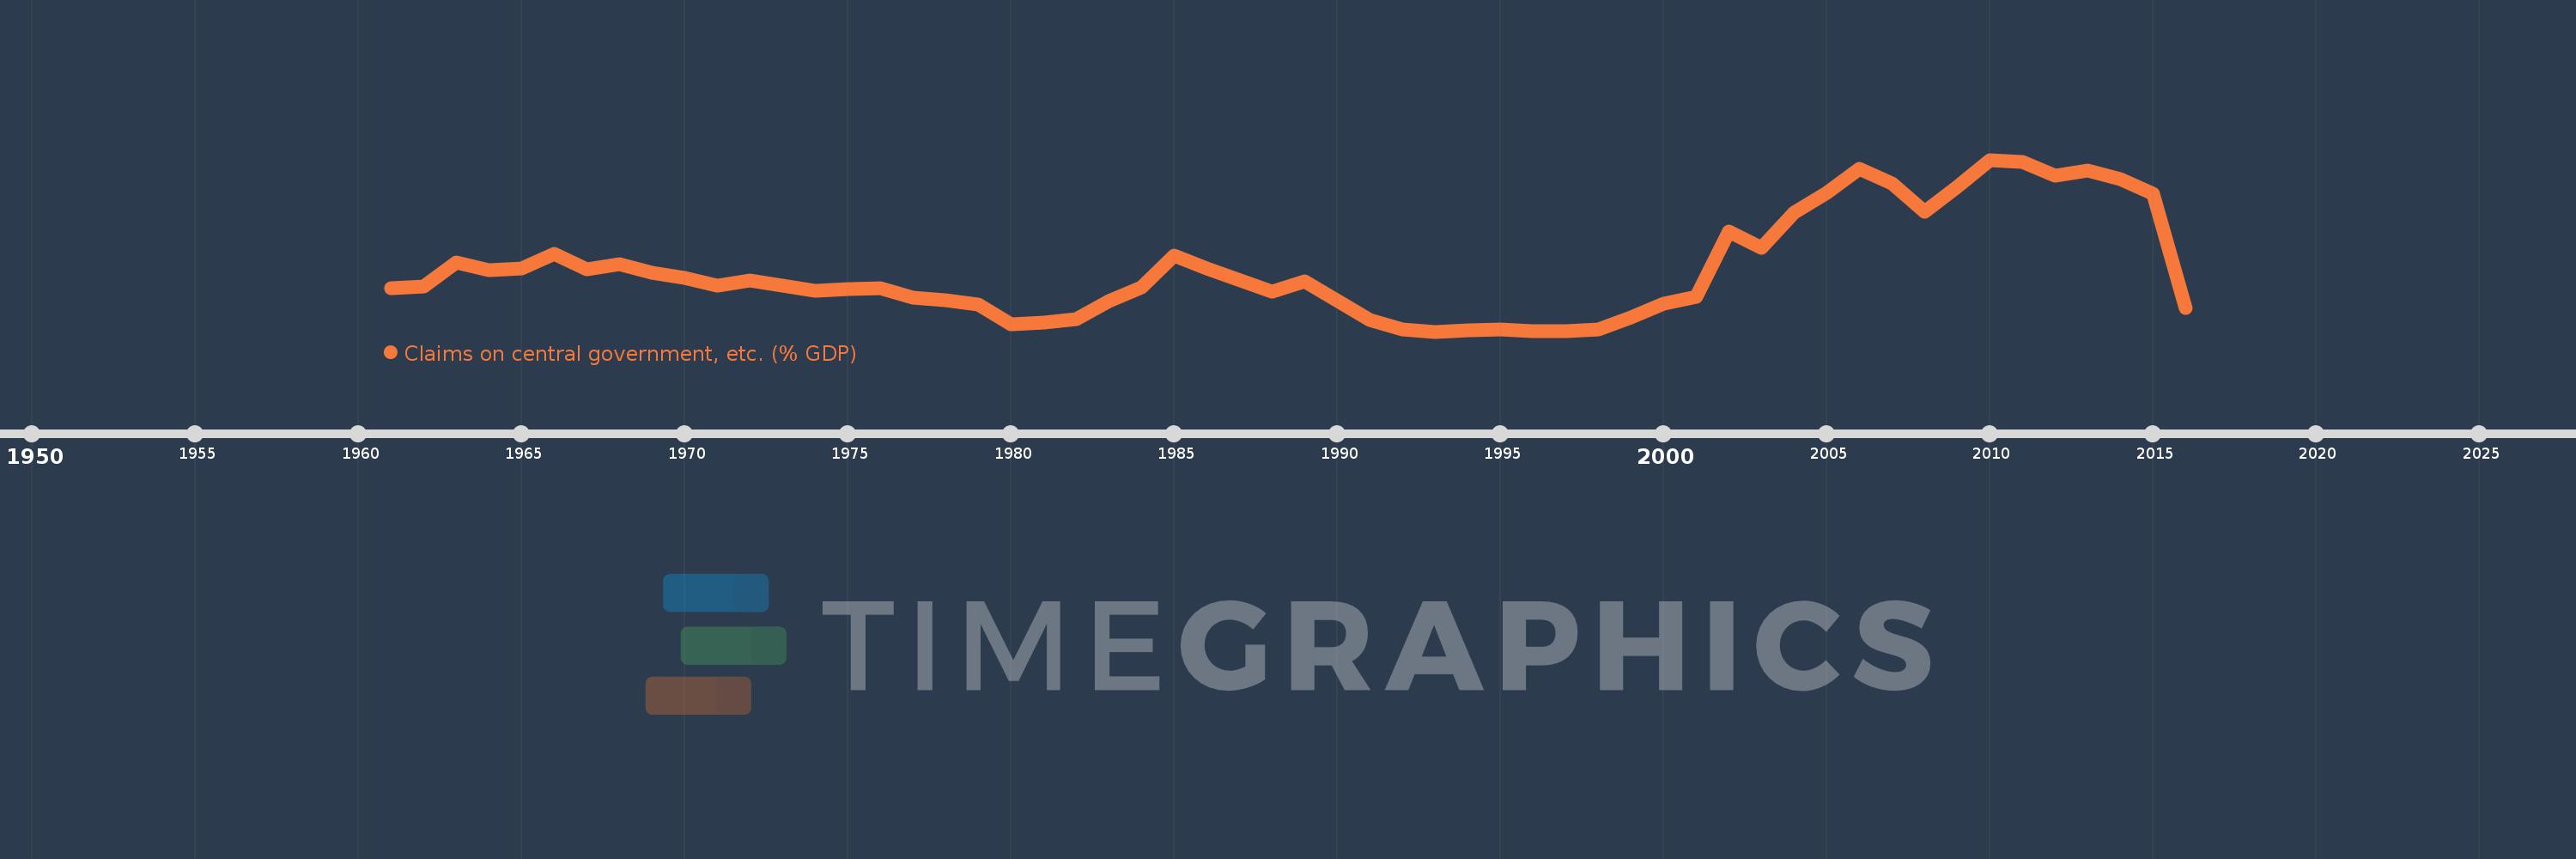
Claims on central government, etc. (% GDP)
2016,2015,2014,2013,2012,2011,2010,2009,2008,2007,2006,2005,2004,2003,2002,2001,2000,1999,1998,1997,1996,1995,1994,1993,1992,1991,1989,1988,1986,1985,1984,1983,1982,1981,1980,1979,1978,1977,1976,1975,1974,1973,1972,1971,1970,1969,1968,1967,1966,1965,1964,1963,1962,1961
This statistics in other country:
AfghanistanAlbaniaAlgeriaAngolaAntigua and BarbudaArab WorldArgentinaArmeniaArubaAustraliaAustriaAzerbaijanBahamas, TheBahrainBangladeshBarbadosBelarusBelgiumBelizeBeninBhutanBoliviaBosnia and HerzegovinaBotswanaBrazilBrunei DarussalamBulgariaBurkina FasoBurundiCabo VerdeCambodiaCameroonCanadaCaribbean small statesCentral African RepublicCentral Europe and the BalticsChadChileChinaColombiaComorosCongo, Dem. Rep.Congo, Rep.Costa RicaCote d'IvoireCroatiaCyprusCzech RepublicDenmarkDjiboutiDominicaDominican RepublicEarly-demographic dividendEast Asia & PacificEast Asia & Pacific (excluding high income)East Asia & Pacific (IDA & IBRD countries)EcuadorEgypt, Arab Rep.El SalvadorEquatorial GuineaEritreaEstoniaEthiopiaEuro areaEurope & Central AsiaEurope & Central Asia (excluding high income)Europe & Central Asia (IDA & IBRD countries)European UnionFijiFinlandFragile and conflict affected situationsFranceGabonGambia, TheGeorgiaGermanyGhanaGreeceGrenadaGuatemalaGuineaGuinea-BissauGuyanaHaitiHeavily indebted poor countries (HIPC)High incomeHondurasHong Kong SAR, ChinaHungaryIBRD onlyIcelandIDA & IBRD totalIDA blendIDA onlyIDA totalIndiaIndonesiaIran, Islamic Rep.IraqIrelandIsraelItalyJamaicaJapanJordanKazakhstanKenyaKorea, Rep.KosovoKuwaitKyrgyz RepublicLao PDRLate-demographic dividendLatin America & Caribbean Latin America & Caribbean (excluding high income)Latin America & the Caribbean (IDA & IBRD countries)LatviaLeast developed countries: UN classificationLebanonLesothoLiberiaLibyaLithuaniaLow & middle incomeLow incomeLower middle incomeLuxembourgMacao SAR, ChinaMacedonia, FYRMadagascarMalawiMalaysiaMaldivesMaliMaltaMauritaniaMauritiusMexicoMicronesia, Fed. Sts.Middle East & North AfricaMiddle East & North Africa (excluding high income)Middle East & North Africa (IDA & IBRD countries)Middle incomeMoldovaMongoliaMontenegroMoroccoMozambiqueMyanmarNamibiaNepalNetherlandsNew ZealandNicaraguaNigerNigeriaNorth AmericaNorwayOECD membersOmanOther small statesPacific island small statesPakistanPanamaPapua New GuineaParaguayPeruPhilippinesPolandPortugalPost-demographic dividendPre-demographic dividendQatarRomaniaRussian FederationRwandaSamoaSao Tome and PrincipeSaudi ArabiaSenegalSerbiaSeychellesSierra LeoneSingaporeSlovak RepublicSloveniaSmall statesSolomon IslandsSouth AfricaSouth AsiaSouth Asia (IDA & IBRD)South SudanSpainSri LankaSt. Kitts and NevisSt. LuciaSt. Vincent and the GrenadinesSub-Saharan Africa Sub-Saharan Africa (excluding high income)Sub-Saharan Africa (IDA & IBRD countries)SudanSurinameSwazilandSwedenSwitzerlandSyrian Arab RepublicTajikistanTanzaniaThailandTimor-LesteTogoTongaTrinidad and TobagoTunisiaTurkeyUgandaUkraineUnited Arab EmiratesUnited KingdomUnited StatesUpper middle incomeUruguayVanuatuVenezuela, RBVietnamWest Bank and GazaWorldYemen, Rep.ZambiaZimbabwe Timeline:
This timeline shows a graph from 1961 to 2016 of Colombia. No data until 1960. Number of actual observations by date: 54.
Source name:
World Development Indicators
Source organization:
International Monetary Fund, International Financial Statistics and data files, and World Bank and OECD GDP estimates.
Categories, topics:
Financial Sector
Last updated:
apr 23, 2017
Indicators value changes by year
Minimum:
-0.855
jan 1, 1993
Maximum:
19.045
jan 1, 2010
At the date of observation
Value
Absolute change
Change from previous value
jan 1, 1961
4.203
+4.203
0.0%
jan 1, 1962
4.373
+0.17
4.04%
jan 1, 1963
7.2
+2.827
64.65%
jan 1, 1964
6.299
-0.902
-12.53%
jan 1, 1965
6.44
+0.141
2.24%
jan 1, 1966
8.152
+1.712
26.58%
jan 1, 1967
6.388
-1.764
-21.64%
jan 1, 1968
6.926
+0.538
8.42%
jan 1, 1969
6.008
-0.918
-13.25%
jan 1, 1970
5.377
-0.631
-10.5%
jan 1, 1971
4.496
-0.881
-16.39%
jan 1, 1972
5.055
+0.559
12.44%
jan 1, 1973
4.442
-0.613
-12.13%
jan 1, 1974
3.877
-0.564
-12.71%
jan 1, 1975
4.101
+0.223
5.76%
jan 1, 1976
4.161
+0.06
1.47%
jan 1, 1977
3.125
-1.036
-24.89%
jan 1, 1978
2.728
-0.397
-12.7%
jan 1, 1979
2.328
-0.4
-14.68%
jan 1, 1980
-0.057
-2.385
-102.46%
jan 1, 1981
0.235
+0.292
-509.31%
jan 1, 1982
0.57
+0.336
142.94%
jan 1, 1983
2.656
+2.086
365.66%
jan 1, 1984
4.275
+1.619
60.93%
jan 1, 1985
7.936
+3.661
85.64%
jan 1, 1986
6.432
-1.504
-18.95%
jan 1, 1988
3.744
-2.688
-41.79%
jan 1, 1989
4.926
+1.182
31.56%
jan 1, 1991
0.465
-4.46
-90.55%
jan 1, 1992
-0.6
-1.065
-229.01%
jan 1, 1993
-0.855
-0.255
42.47%
jan 1, 1994
-0.659
+0.196
-22.96%
jan 1, 1995
-0.578
+0.08
-12.21%
jan 1, 1996
-0.788
-0.21
36.31%
jan 1, 1997
-0.765
+0.023
-2.93%
jan 1, 1998
-0.562
+0.203
-26.51%
jan 1, 1999
0.751
+1.313
-233.46%
jan 1, 2000
2.34
+1.589
211.75%
jan 1, 2001
3.207
+0.867
37.07%
jan 1, 2002
10.691
+7.484
233.35%
jan 1, 2003
8.838
-1.854
-17.34%
jan 1, 2004
12.953
+4.115
46.56%
jan 1, 2005
15.192
+2.239
17.28%
jan 1, 2006
18.019
+2.827
18.61%
jan 1, 2007
16.299
-1.72
-9.55%
jan 1, 2008
13.044
-3.255
-19.97%
jan 1, 2009
15.946
+2.902
22.25%
jan 1, 2010
19.045
+3.1
19.44%
jan 1, 2011
18.844
-0.201
-1.05%
jan 1, 2012
17.189
-1.656
-8.79%
jan 1, 2013
17.802
+0.613
3.57%
jan 1, 2014
16.811
-0.991
-5.57%
jan 1, 2015
15.14
-1.671
-9.94%
jan 1, 2016
1.928
-13.212
-87.27%
Ranking of countries by current statistics by years


Comments: