29
/
en
AIzaSyAYiBZKx7MnpbEhh9jyipgxe19OcubqV5w
April 1, 2024
220563
Paraguay
PRY
true
2
1
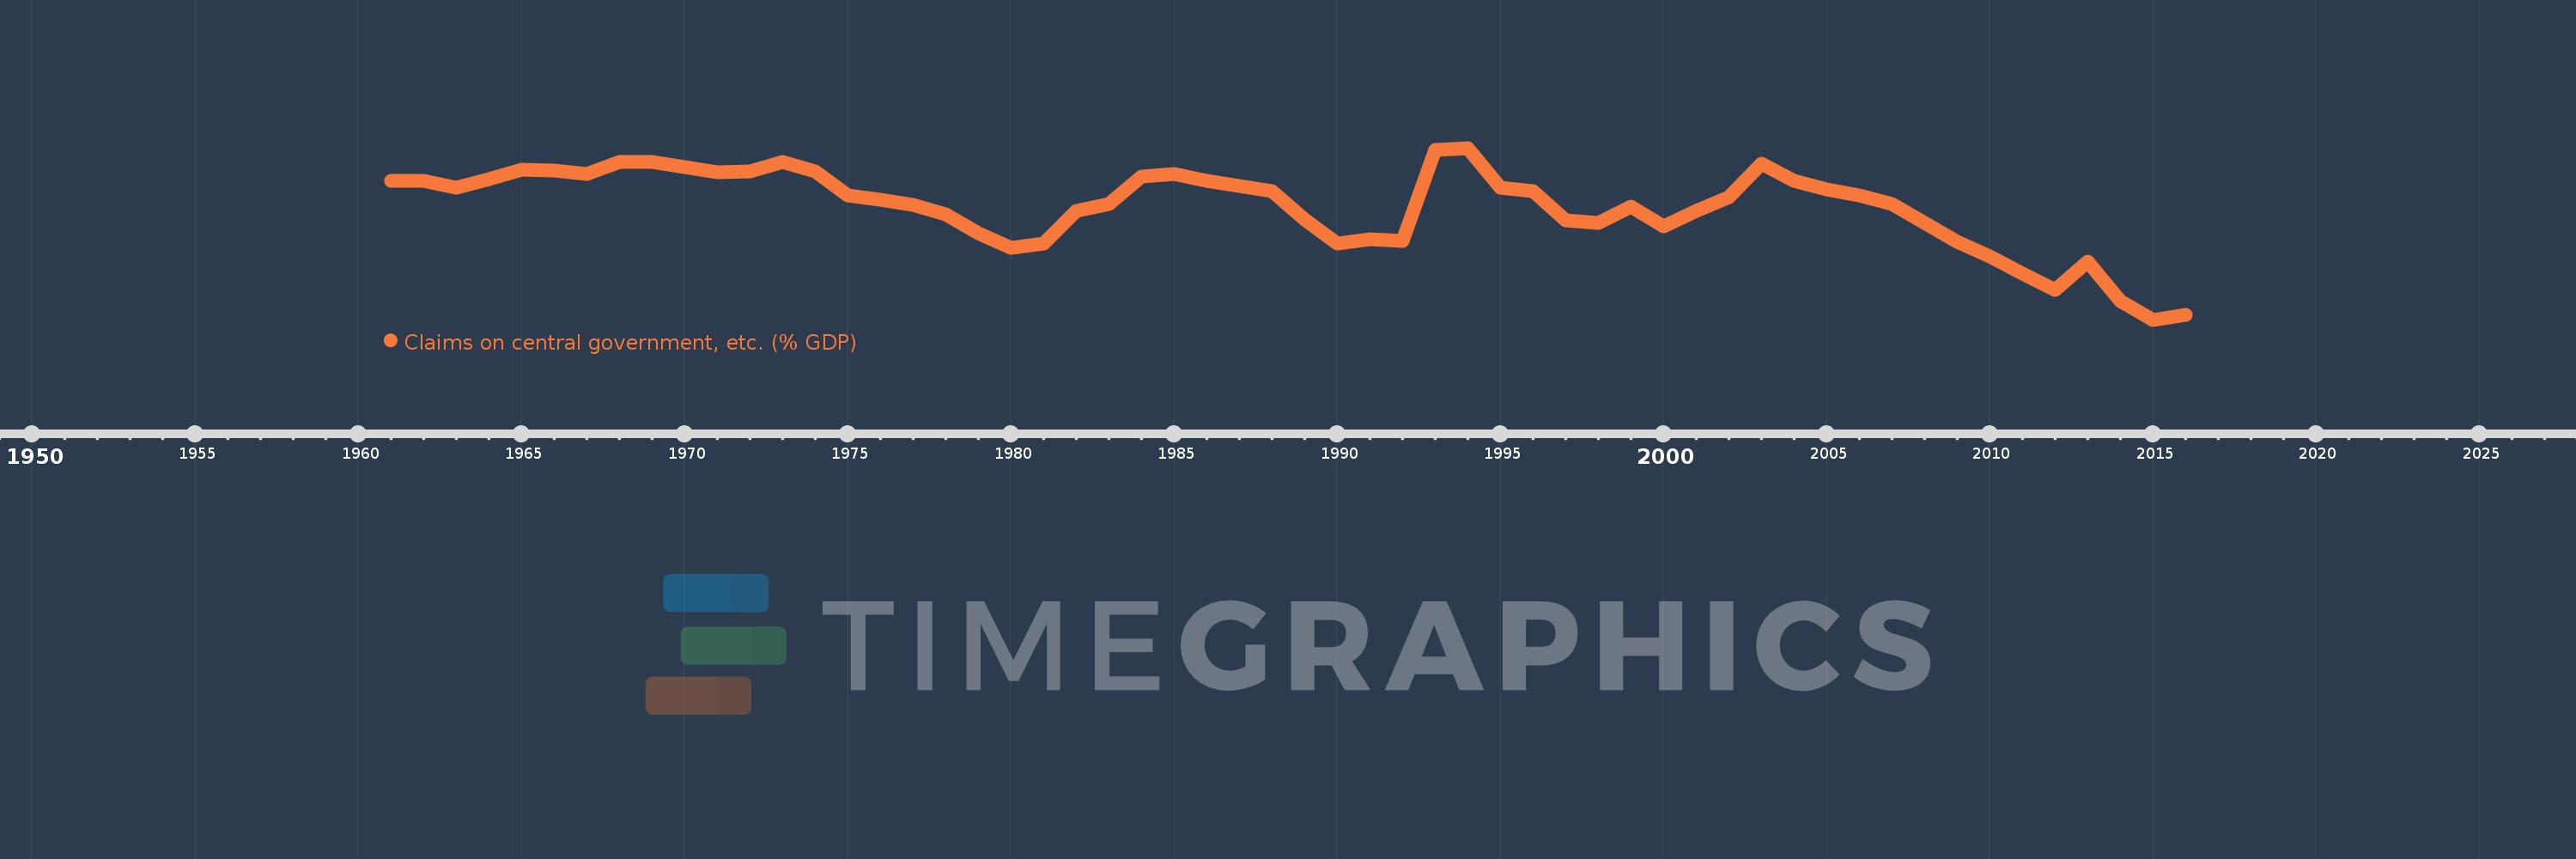
Claims on central government, etc. (% GDP)
2016,2015,2014,2013,2012,2011,2010,2009,2008,2007,2006,2005,2004,2003,2002,2001,2000,1999,1998,1997,1996,1995,1994,1993,1992,1991,1990,1989,1988,1987,1986,1985,1984,1983,1982,1981,1980,1979,1978,1977,1976,1975,1974,1973,1972,1971,1970,1969,1968,1967,1966,1965,1964,1963,1962,1961
This statistics in other country:
AfghanistanAlbaniaAlgeriaAngolaAntigua and BarbudaArab WorldArgentinaArmeniaArubaAustraliaAustriaAzerbaijanBahamas, TheBahrainBangladeshBarbadosBelarusBelgiumBelizeBeninBhutanBoliviaBosnia and HerzegovinaBotswanaBrazilBrunei DarussalamBulgariaBurkina FasoBurundiCabo VerdeCambodiaCameroonCanadaCaribbean small statesCentral African RepublicCentral Europe and the BalticsChadChileChinaColombiaComorosCongo, Dem. Rep.Congo, Rep.Costa RicaCote d'IvoireCroatiaCyprusCzech RepublicDenmarkDjiboutiDominicaDominican RepublicEarly-demographic dividendEast Asia & PacificEast Asia & Pacific (excluding high income)East Asia & Pacific (IDA & IBRD countries)EcuadorEgypt, Arab Rep.El SalvadorEquatorial GuineaEritreaEstoniaEthiopiaEuro areaEurope & Central AsiaEurope & Central Asia (excluding high income)Europe & Central Asia (IDA & IBRD countries)European UnionFijiFinlandFragile and conflict affected situationsFranceGabonGambia, TheGeorgiaGermanyGhanaGreeceGrenadaGuatemalaGuineaGuinea-BissauGuyanaHaitiHeavily indebted poor countries (HIPC)High incomeHondurasHong Kong SAR, ChinaHungaryIBRD onlyIcelandIDA & IBRD totalIDA blendIDA onlyIDA totalIndiaIndonesiaIran, Islamic Rep.IraqIrelandIsraelItalyJamaicaJapanJordanKazakhstanKenyaKorea, Rep.KosovoKuwaitKyrgyz RepublicLao PDRLate-demographic dividendLatin America & Caribbean Latin America & Caribbean (excluding high income)Latin America & the Caribbean (IDA & IBRD countries)LatviaLeast developed countries: UN classificationLebanonLesothoLiberiaLibyaLithuaniaLow & middle incomeLow incomeLower middle incomeLuxembourgMacao SAR, ChinaMacedonia, FYRMadagascarMalawiMalaysiaMaldivesMaliMaltaMauritaniaMauritiusMexicoMicronesia, Fed. Sts.Middle East & North AfricaMiddle East & North Africa (excluding high income)Middle East & North Africa (IDA & IBRD countries)Middle incomeMoldovaMongoliaMontenegroMoroccoMozambiqueMyanmarNamibiaNepalNetherlandsNew ZealandNicaraguaNigerNigeriaNorth AmericaNorwayOECD membersOmanOther small statesPacific island small statesPakistanPanamaPapua New GuineaParaguayPeruPhilippinesPolandPortugalPost-demographic dividendPre-demographic dividendQatarRomaniaRussian FederationRwandaSamoaSao Tome and PrincipeSaudi ArabiaSenegalSerbiaSeychellesSierra LeoneSingaporeSlovak RepublicSloveniaSmall statesSolomon IslandsSouth AfricaSouth AsiaSouth Asia (IDA & IBRD)South SudanSpainSri LankaSt. Kitts and NevisSt. LuciaSt. Vincent and the GrenadinesSub-Saharan Africa Sub-Saharan Africa (excluding high income)Sub-Saharan Africa (IDA & IBRD countries)SudanSurinameSwazilandSwedenSwitzerlandSyrian Arab RepublicTajikistanTanzaniaThailandTimor-LesteTogoTongaTrinidad and TobagoTunisiaTurkeyUgandaUkraineUnited Arab EmiratesUnited KingdomUnited StatesUpper middle incomeUruguayVanuatuVenezuela, RBVietnamWest Bank and GazaWorldYemen, Rep.ZambiaZimbabwe Timeline:
This timeline shows a graph from 1961 to 2016 of Paraguay. No data until 1960. Number of actual observations by date: 56.
Source name:
World Development Indicators
Source organization:
International Monetary Fund, International Financial Statistics and data files, and World Bank and OECD GDP estimates.
Categories, topics:
Financial Sector
Last updated:
apr 23, 2017
Indicators value changes by year
Minimum:
-9.373
jan 1, 2015
At the date of observation
Value
Absolute change
Change from previous value
jan 1, 1961
1.832
+1.832
0.0%
jan 1, 1962
1.84
+0.007
0.4%
jan 1, 1963
1.315
-0.525
-28.54%
jan 1, 1964
1.987
+0.672
51.13%
jan 1, 1965
2.739
+0.753
37.89%
jan 1, 1966
2.674
-0.066
-2.4%
jan 1, 1967
2.447
-0.227
-8.49%
jan 1, 1968
3.366
+0.919
37.57%
jan 1, 1969
3.369
+0.004
0.1%
jan 1, 1970
2.984
-0.385
-11.44%
jan 1, 1971
2.573
-0.411
-13.78%
jan 1, 1972
2.655
+0.082
3.2%
jan 1, 1973
3.394
+0.739
27.82%
jan 1, 1974
2.622
-0.772
-22.73%
jan 1, 1975
0.673
-1.949
-74.32%
jan 1, 1976
0.329
-0.345
-51.21%
jan 1, 1977
-0.088
-0.417
-126.87%
jan 1, 1978
-0.828
-0.739
837.62%
jan 1, 1979
-2.363
-1.536
185.5%
jan 1, 1980
-3.54
-1.177
49.8%
jan 1, 1981
-3.201
+0.34
-9.59%
jan 1, 1982
-0.592
+2.609
-81.51%
jan 1, 1983
0.014
+0.606
-102.39%
jan 1, 1984
2.213
+2.199
15.53K%
jan 1, 1985
2.453
+0.24
10.85%
jan 1, 1986
1.838
-0.615
-25.07%
jan 1, 1987
1.432
-0.405
-22.06%
jan 1, 1988
1.036
-0.396
-27.65%
jan 1, 1989
-1.272
-2.309
-222.78%
jan 1, 1990
-3.193
-1.92
150.92%
jan 1, 1991
-2.887
+0.306
-9.59%
jan 1, 1992
-2.975
-0.088
3.05%
jan 1, 1993
4.368
+7.343
-246.86%
jan 1, 1994
4.528
+0.159
3.65%
jan 1, 1995
1.335
-3.193
-70.51%
jan 1, 1996
1.017
-0.319
-23.86%
jan 1, 1997
-1.333
-2.35
-231.14%
jan 1, 1998
-1.567
-0.234
17.53%
jan 1, 1999
-0.225
+1.342
-85.67%
jan 1, 2000
-1.843
-1.618
720.71%
jan 1, 2001
-0.573
+1.27
-68.9%
jan 1, 2002
0.531
+1.104
-192.69%
jan 1, 2003
3.252
+2.721
512.21%
jan 1, 2004
1.9
-1.352
-41.58%
jan 1, 2005
1.166
-0.734
-38.61%
jan 1, 2006
0.707
-0.459
-39.37%
jan 1, 2007
0.011
-0.696
-98.49%
jan 1, 2008
-1.509
-1.52
-14.23K%
jan 1, 2009
-3.09
-1.581
104.77%
jan 1, 2010
-4.222
-1.132
36.65%
jan 1, 2011
-5.675
-1.453
34.42%
jan 1, 2012
-6.939
-1.264
22.27%
jan 1, 2013
-4.658
+2.282
-32.88%
jan 1, 2014
-7.879
-3.222
69.17%
jan 1, 2015
-9.373
-1.494
18.96%
jan 1, 2016
-8.957
+0.416
-4.44%
Ranking of countries by current statistics by years


Comments: