29
/
en
AIzaSyAYiBZKx7MnpbEhh9jyipgxe19OcubqV5w
April 1, 2024
68641
Antigua and Barbuda
ATG
true
2
1
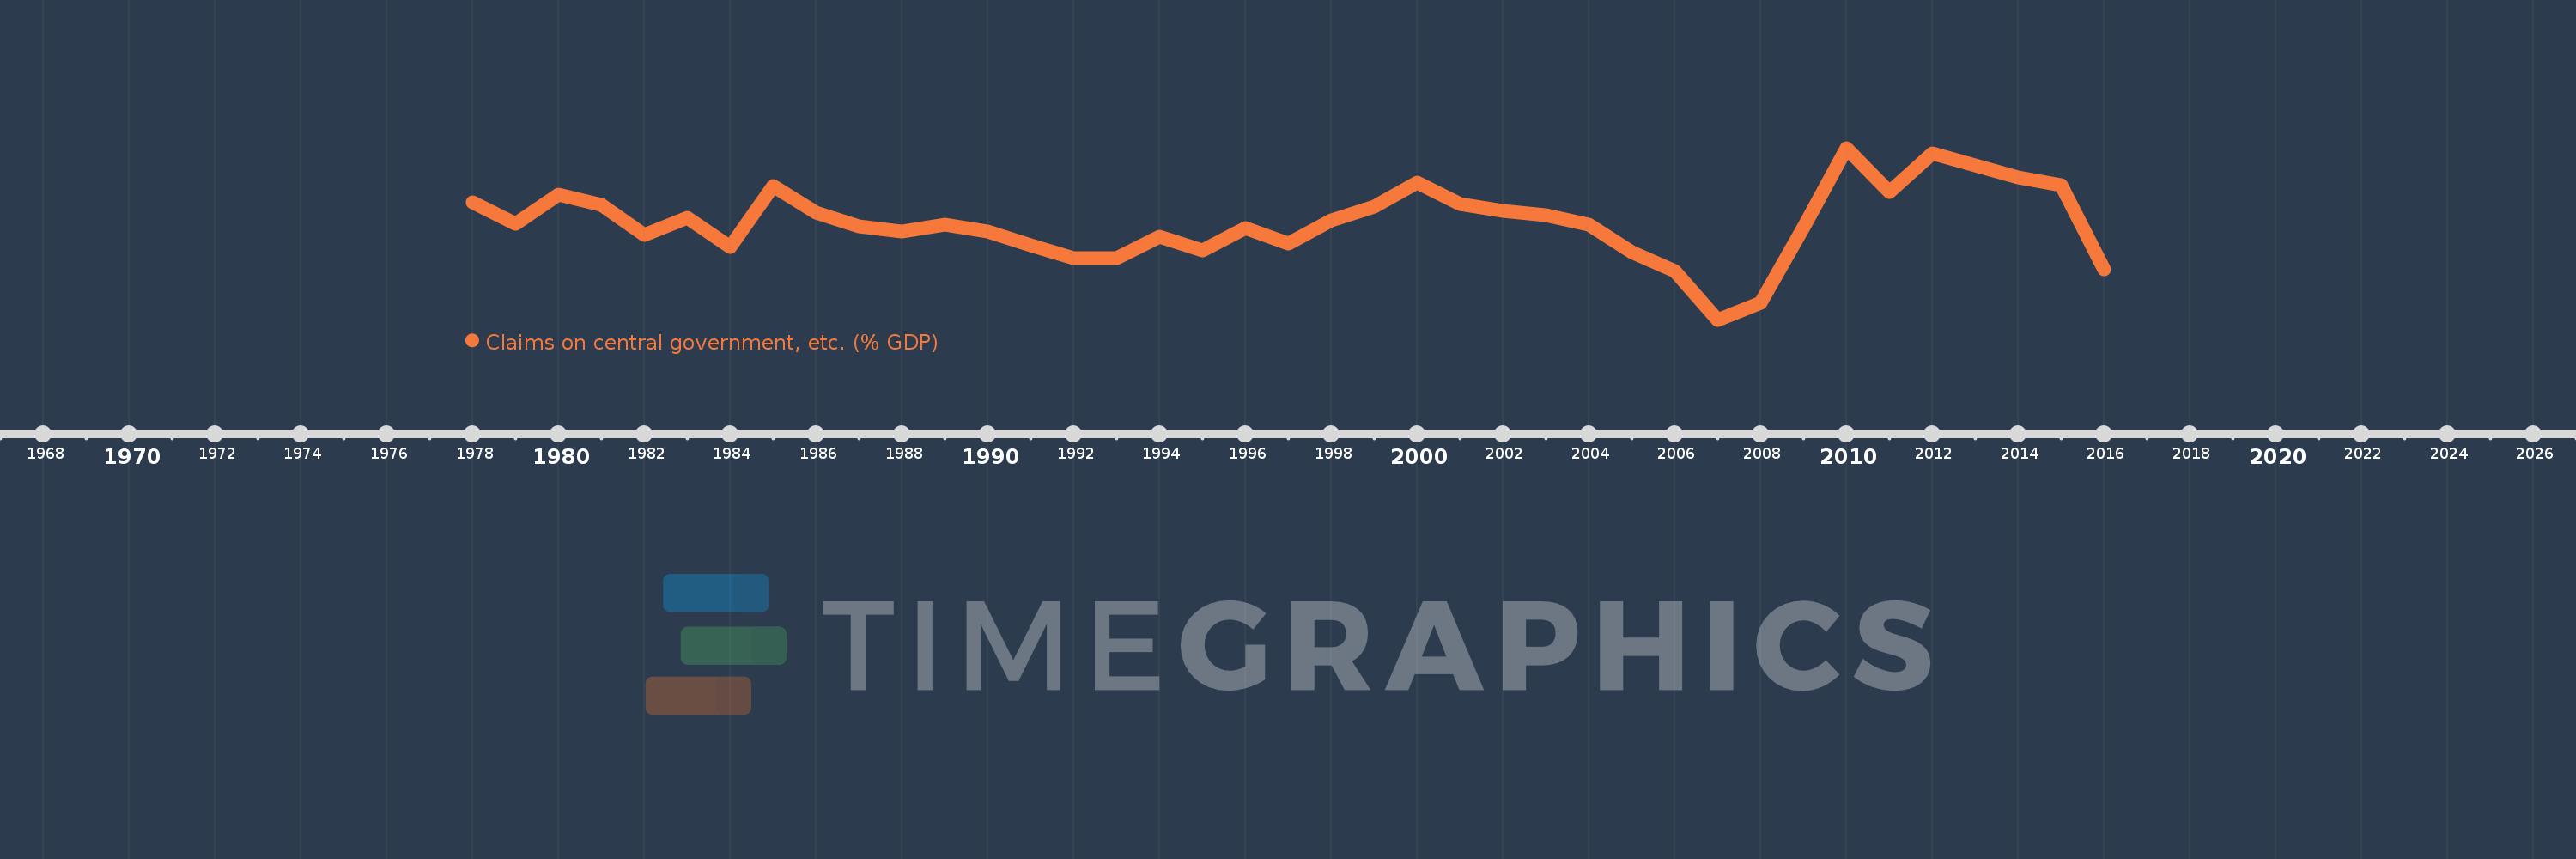
Claims on central government, etc. (% GDP)
2016,2015,2014,2013,2012,2011,2010,2009,2008,2007,2006,2005,2004,2003,2002,2001,2000,1999,1998,1997,1996,1995,1994,1993,1992,1991,1990,1989,1988,1987,1986,1985,1984,1983,1982,1981,1980,1979,1978
This statistics in other country:
AfghanistanAlbaniaAlgeriaAngolaAntigua and BarbudaArab WorldArgentinaArmeniaArubaAustraliaAustriaAzerbaijanBahamas, TheBahrainBangladeshBarbadosBelarusBelgiumBelizeBeninBhutanBoliviaBosnia and HerzegovinaBotswanaBrazilBrunei DarussalamBulgariaBurkina FasoBurundiCabo VerdeCambodiaCameroonCanadaCaribbean small statesCentral African RepublicCentral Europe and the BalticsChadChileChinaColombiaComorosCongo, Dem. Rep.Congo, Rep.Costa RicaCote d'IvoireCroatiaCyprusCzech RepublicDenmarkDjiboutiDominicaDominican RepublicEarly-demographic dividendEast Asia & PacificEast Asia & Pacific (excluding high income)East Asia & Pacific (IDA & IBRD countries)EcuadorEgypt, Arab Rep.El SalvadorEquatorial GuineaEritreaEstoniaEthiopiaEuro areaEurope & Central AsiaEurope & Central Asia (excluding high income)Europe & Central Asia (IDA & IBRD countries)European UnionFijiFinlandFragile and conflict affected situationsFranceGabonGambia, TheGeorgiaGermanyGhanaGreeceGrenadaGuatemalaGuineaGuinea-BissauGuyanaHaitiHeavily indebted poor countries (HIPC)High incomeHondurasHong Kong SAR, ChinaHungaryIBRD onlyIcelandIDA & IBRD totalIDA blendIDA onlyIDA totalIndiaIndonesiaIran, Islamic Rep.IraqIrelandIsraelItalyJamaicaJapanJordanKazakhstanKenyaKorea, Rep.KosovoKuwaitKyrgyz RepublicLao PDRLate-demographic dividendLatin America & Caribbean Latin America & Caribbean (excluding high income)Latin America & the Caribbean (IDA & IBRD countries)LatviaLeast developed countries: UN classificationLebanonLesothoLiberiaLibyaLithuaniaLow & middle incomeLow incomeLower middle incomeLuxembourgMacao SAR, ChinaMacedonia, FYRMadagascarMalawiMalaysiaMaldivesMaliMaltaMauritaniaMauritiusMexicoMicronesia, Fed. Sts.Middle East & North AfricaMiddle East & North Africa (excluding high income)Middle East & North Africa (IDA & IBRD countries)Middle incomeMoldovaMongoliaMontenegroMoroccoMozambiqueMyanmarNamibiaNepalNetherlandsNew ZealandNicaraguaNigerNigeriaNorth AmericaNorwayOECD membersOmanOther small statesPacific island small statesPakistanPanamaPapua New GuineaParaguayPeruPhilippinesPolandPortugalPost-demographic dividendPre-demographic dividendQatarRomaniaRussian FederationRwandaSamoaSao Tome and PrincipeSaudi ArabiaSenegalSerbiaSeychellesSierra LeoneSingaporeSlovak RepublicSloveniaSmall statesSolomon IslandsSouth AfricaSouth AsiaSouth Asia (IDA & IBRD)South SudanSpainSri LankaSt. Kitts and NevisSt. LuciaSt. Vincent and the GrenadinesSub-Saharan Africa Sub-Saharan Africa (excluding high income)Sub-Saharan Africa (IDA & IBRD countries)SudanSurinameSwazilandSwedenSwitzerlandSyrian Arab RepublicTajikistanTanzaniaThailandTimor-LesteTogoTongaTrinidad and TobagoTunisiaTurkeyUgandaUkraineUnited Arab EmiratesUnited KingdomUnited StatesUpper middle incomeUruguayVanuatuVenezuela, RBVietnamWest Bank and GazaWorldYemen, Rep.ZambiaZimbabwe Timeline:
This timeline shows a graph from 1978 to 2016 of Antigua and Barbuda. No data until 1977. Number of actual observations by date: 39.
Source name:
World Development Indicators
Source organization:
International Monetary Fund, International Financial Statistics and data files, and World Bank and OECD GDP estimates.
Categories, topics:
Financial Sector
Last updated:
apr 23, 2017
Indicators value changes by year
Maximum:
18.165
jan 1, 2010
At the date of observation
Value
Absolute change
Change from previous value
jan 1, 1978
14.45
+14.45
0.0%
jan 1, 1979
13.003
-1.447
-10.01%
jan 1, 1980
15.004
+2.0
15.38%
jan 1, 1981
14.246
-0.758
-5.05%
jan 1, 1982
12.207
-2.039
-14.31%
jan 1, 1983
13.392
+1.185
9.7%
jan 1, 1984
11.396
-1.995
-14.9%
jan 1, 1985
15.588
+4.192
36.78%
jan 1, 1986
13.757
-1.831
-11.75%
jan 1, 1987
12.805
-0.952
-6.92%
jan 1, 1988
12.428
-0.378
-2.95%
jan 1, 1989
12.924
+0.496
3.99%
jan 1, 1990
12.427
-0.496
-3.84%
jan 1, 1991
11.501
-0.926
-7.45%
jan 1, 1992
10.646
-0.855
-7.43%
jan 1, 1993
10.611
-0.036
-0.34%
jan 1, 1994
12.078
+1.467
13.83%
jan 1, 1995
11.188
-0.89
-7.37%
jan 1, 1996
12.692
+1.505
13.45%
jan 1, 1997
11.63
-1.062
-8.37%
jan 1, 1998
13.203
+1.573
13.52%
jan 1, 1999
14.158
+0.955
7.23%
jan 1, 2000
15.778
+1.62
11.44%
jan 1, 2001
14.356
-1.422
-9.01%
jan 1, 2002
13.842
-0.515
-3.58%
jan 1, 2003
13.548
-0.294
-2.12%
jan 1, 2004
12.906
-0.642
-4.74%
jan 1, 2005
11.043
-1.864
-14.44%
jan 1, 2006
9.731
-1.312
-11.88%
jan 1, 2007
6.427
-3.304
-33.95%
jan 1, 2008
7.594
+1.167
18.16%
jan 1, 2009
12.758
+5.164
68.0%
jan 1, 2010
18.165
+5.407
42.38%
jan 1, 2011
15.164
-3.001
-16.52%
jan 1, 2012
17.814
+2.649
17.47%
jan 1, 2013
16.962
-0.851
-4.78%
jan 1, 2014
16.155
-0.807
-4.76%
jan 1, 2015
15.629
-0.526
-3.26%
jan 1, 2016
9.85
-5.778
-36.97%
Ranking of countries by current statistics by years


Comments: