29
/
en
AIzaSyAYiBZKx7MnpbEhh9jyipgxe19OcubqV5w
April 1, 2024
245320
South Africa
ZAF
true
2
1
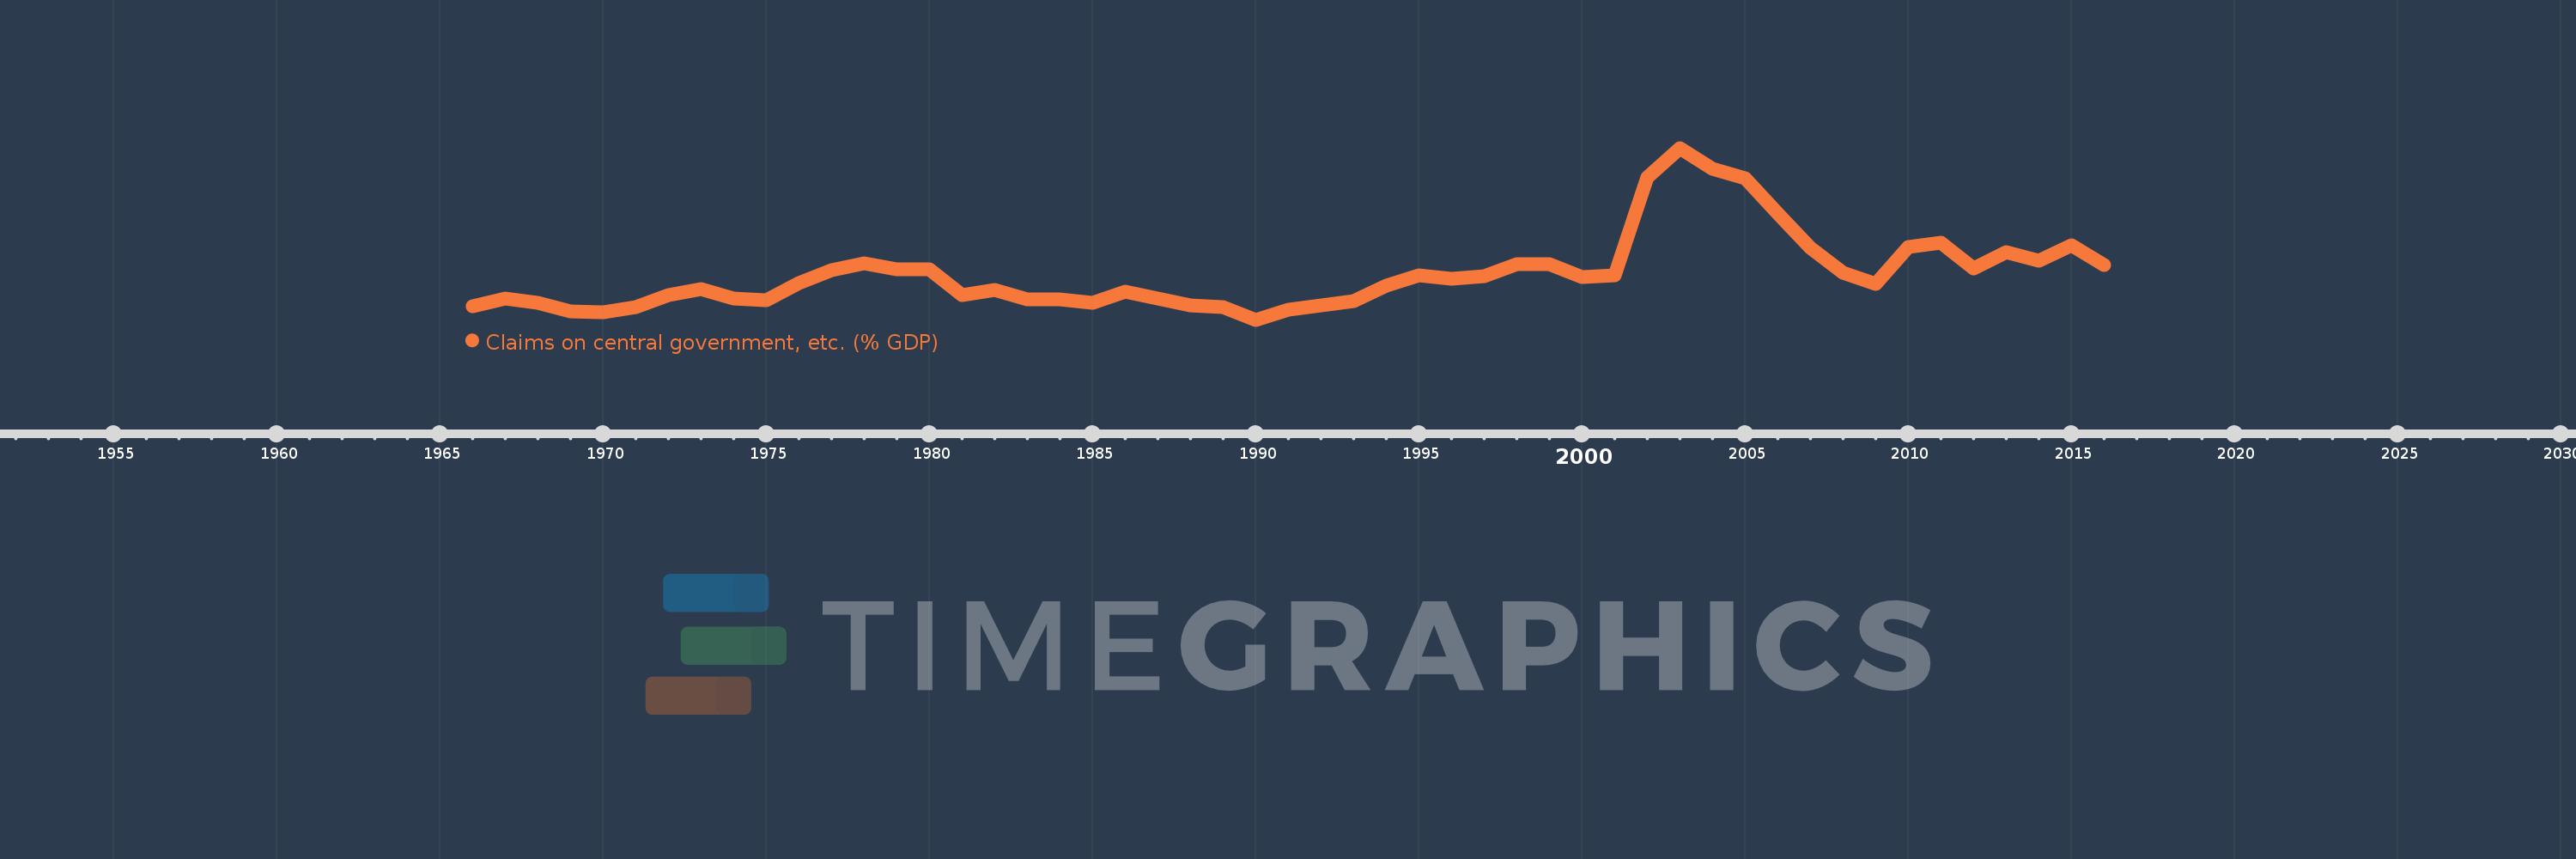
Claims on central government, etc. (% GDP)
2016,2015,2014,2013,2012,2011,2010,2009,2008,2007,2006,2005,2004,2003,2002,2001,2000,1999,1998,1997,1996,1995,1994,1993,1991,1990,1989,1988,1987,1986,1985,1984,1983,1982,1981,1980,1979,1978,1977,1976,1975,1974,1973,1972,1971,1970,1969,1968,1967,1966
This statistics in other country:
AfghanistanAlbaniaAlgeriaAngolaAntigua and BarbudaArab WorldArgentinaArmeniaArubaAustraliaAustriaAzerbaijanBahamas, TheBahrainBangladeshBarbadosBelarusBelgiumBelizeBeninBhutanBoliviaBosnia and HerzegovinaBotswanaBrazilBrunei DarussalamBulgariaBurkina FasoBurundiCabo VerdeCambodiaCameroonCanadaCaribbean small statesCentral African RepublicCentral Europe and the BalticsChadChileChinaColombiaComorosCongo, Dem. Rep.Congo, Rep.Costa RicaCote d'IvoireCroatiaCyprusCzech RepublicDenmarkDjiboutiDominicaDominican RepublicEarly-demographic dividendEast Asia & PacificEast Asia & Pacific (excluding high income)East Asia & Pacific (IDA & IBRD countries)EcuadorEgypt, Arab Rep.El SalvadorEquatorial GuineaEritreaEstoniaEthiopiaEuro areaEurope & Central AsiaEurope & Central Asia (excluding high income)Europe & Central Asia (IDA & IBRD countries)European UnionFijiFinlandFragile and conflict affected situationsFranceGabonGambia, TheGeorgiaGermanyGhanaGreeceGrenadaGuatemalaGuineaGuinea-BissauGuyanaHaitiHeavily indebted poor countries (HIPC)High incomeHondurasHong Kong SAR, ChinaHungaryIBRD onlyIcelandIDA & IBRD totalIDA blendIDA onlyIDA totalIndiaIndonesiaIran, Islamic Rep.IraqIrelandIsraelItalyJamaicaJapanJordanKazakhstanKenyaKorea, Rep.KosovoKuwaitKyrgyz RepublicLao PDRLate-demographic dividendLatin America & Caribbean Latin America & Caribbean (excluding high income)Latin America & the Caribbean (IDA & IBRD countries)LatviaLeast developed countries: UN classificationLebanonLesothoLiberiaLibyaLithuaniaLow & middle incomeLow incomeLower middle incomeLuxembourgMacao SAR, ChinaMacedonia, FYRMadagascarMalawiMalaysiaMaldivesMaliMaltaMauritaniaMauritiusMexicoMicronesia, Fed. Sts.Middle East & North AfricaMiddle East & North Africa (excluding high income)Middle East & North Africa (IDA & IBRD countries)Middle incomeMoldovaMongoliaMontenegroMoroccoMozambiqueMyanmarNamibiaNepalNetherlandsNew ZealandNicaraguaNigerNigeriaNorth AmericaNorwayOECD membersOmanOther small statesPacific island small statesPakistanPanamaPapua New GuineaParaguayPeruPhilippinesPolandPortugalPost-demographic dividendPre-demographic dividendQatarRomaniaRussian FederationRwandaSamoaSao Tome and PrincipeSaudi ArabiaSenegalSerbiaSeychellesSierra LeoneSingaporeSlovak RepublicSloveniaSmall statesSolomon IslandsSouth AfricaSouth AsiaSouth Asia (IDA & IBRD)South SudanSpainSri LankaSt. Kitts and NevisSt. LuciaSt. Vincent and the GrenadinesSub-Saharan Africa Sub-Saharan Africa (excluding high income)Sub-Saharan Africa (IDA & IBRD countries)SudanSurinameSwazilandSwedenSwitzerlandSyrian Arab RepublicTajikistanTanzaniaThailandTimor-LesteTogoTongaTrinidad and TobagoTunisiaTurkeyUgandaUkraineUnited Arab EmiratesUnited KingdomUnited StatesUpper middle incomeUruguayVanuatuVenezuela, RBVietnamWest Bank and GazaWorldYemen, Rep.ZambiaZimbabwe Timeline:
This timeline shows a graph from 1966 to 2016 of South Africa. No data until 1965. Number of actual observations by date: 50.
Source name:
World Development Indicators
Source organization:
International Monetary Fund, International Financial Statistics and data files, and World Bank and OECD GDP estimates.
Categories, topics:
Financial Sector
Last updated:
apr 23, 2017
Indicators value changes by year
Maximum:
34.614
jan 1, 2003
At the date of observation
Value
Absolute change
Change from previous value
jan 1, 1966
11.529
+11.529
0.0%
jan 1, 1967
12.736
+1.206
10.46%
jan 1, 1968
12.133
-0.603
-4.73%
jan 1, 1969
10.886
-1.247
-10.28%
jan 1, 1970
10.705
-0.181
-1.66%
jan 1, 1971
11.465
+0.76
7.1%
jan 1, 1972
13.253
+1.788
15.6%
jan 1, 1973
14.126
+0.872
6.58%
jan 1, 1974
12.715
-1.411
-9.99%
jan 1, 1975
12.469
-0.246
-1.93%
jan 1, 1976
15.017
+2.548
20.43%
jan 1, 1977
16.812
+1.795
11.96%
jan 1, 1978
17.829
+1.017
6.05%
jan 1, 1979
16.994
-0.835
-4.68%
jan 1, 1980
16.936
-0.058
-0.34%
jan 1, 1981
13.215
-3.721
-21.97%
jan 1, 1982
13.937
+0.721
5.46%
jan 1, 1983
12.638
-1.298
-9.32%
jan 1, 1984
12.568
-0.07
-0.55%
jan 1, 1985
12.048
-0.52
-4.14%
jan 1, 1986
13.667
+1.618
13.43%
jan 1, 1987
12.751
-0.915
-6.7%
jan 1, 1988
11.724
-1.027
-8.06%
jan 1, 1989
11.518
-0.206
-1.76%
jan 1, 1990
9.62
-1.898
-16.48%
jan 1, 1991
11.072
+1.452
15.1%
jan 1, 1993
12.382
+1.31
11.83%
jan 1, 1994
14.604
+2.223
17.95%
jan 1, 1995
16.044
+1.44
9.86%
jan 1, 1996
15.617
-0.428
-2.67%
jan 1, 1997
15.916
+0.3
1.92%
jan 1, 1998
17.744
+1.828
11.48%
jan 1, 1999
17.654
-0.09
-0.51%
jan 1, 2000
15.818
-1.836
-10.4%
jan 1, 2001
16.083
+0.265
1.67%
jan 1, 2002
30.322
+14.24
88.54%
jan 1, 2003
34.614
+4.292
14.15%
jan 1, 2004
31.585
-3.029
-8.75%
jan 1, 2005
30.234
-1.351
-4.28%
jan 1, 2006
25.113
-5.121
-16.94%
jan 1, 2007
20.094
-5.019
-19.99%
jan 1, 2008
16.451
-3.643
-18.13%
jan 1, 2009
14.835
-1.616
-9.82%
jan 1, 2010
20.267
+5.432
36.62%
jan 1, 2011
20.844
+0.577
2.85%
jan 1, 2012
17.052
-3.793
-18.2%
jan 1, 2013
19.412
+2.36
13.84%
jan 1, 2014
18.265
-1.147
-5.91%
jan 1, 2015
20.395
+2.13
11.66%
jan 1, 2016
17.603
-2.792
-13.69%
Ranking of countries by current statistics by years


Comments: