29
/
en
AIzaSyAYiBZKx7MnpbEhh9jyipgxe19OcubqV5w
April 1, 2024
56079
Small states
SST
false
2
1
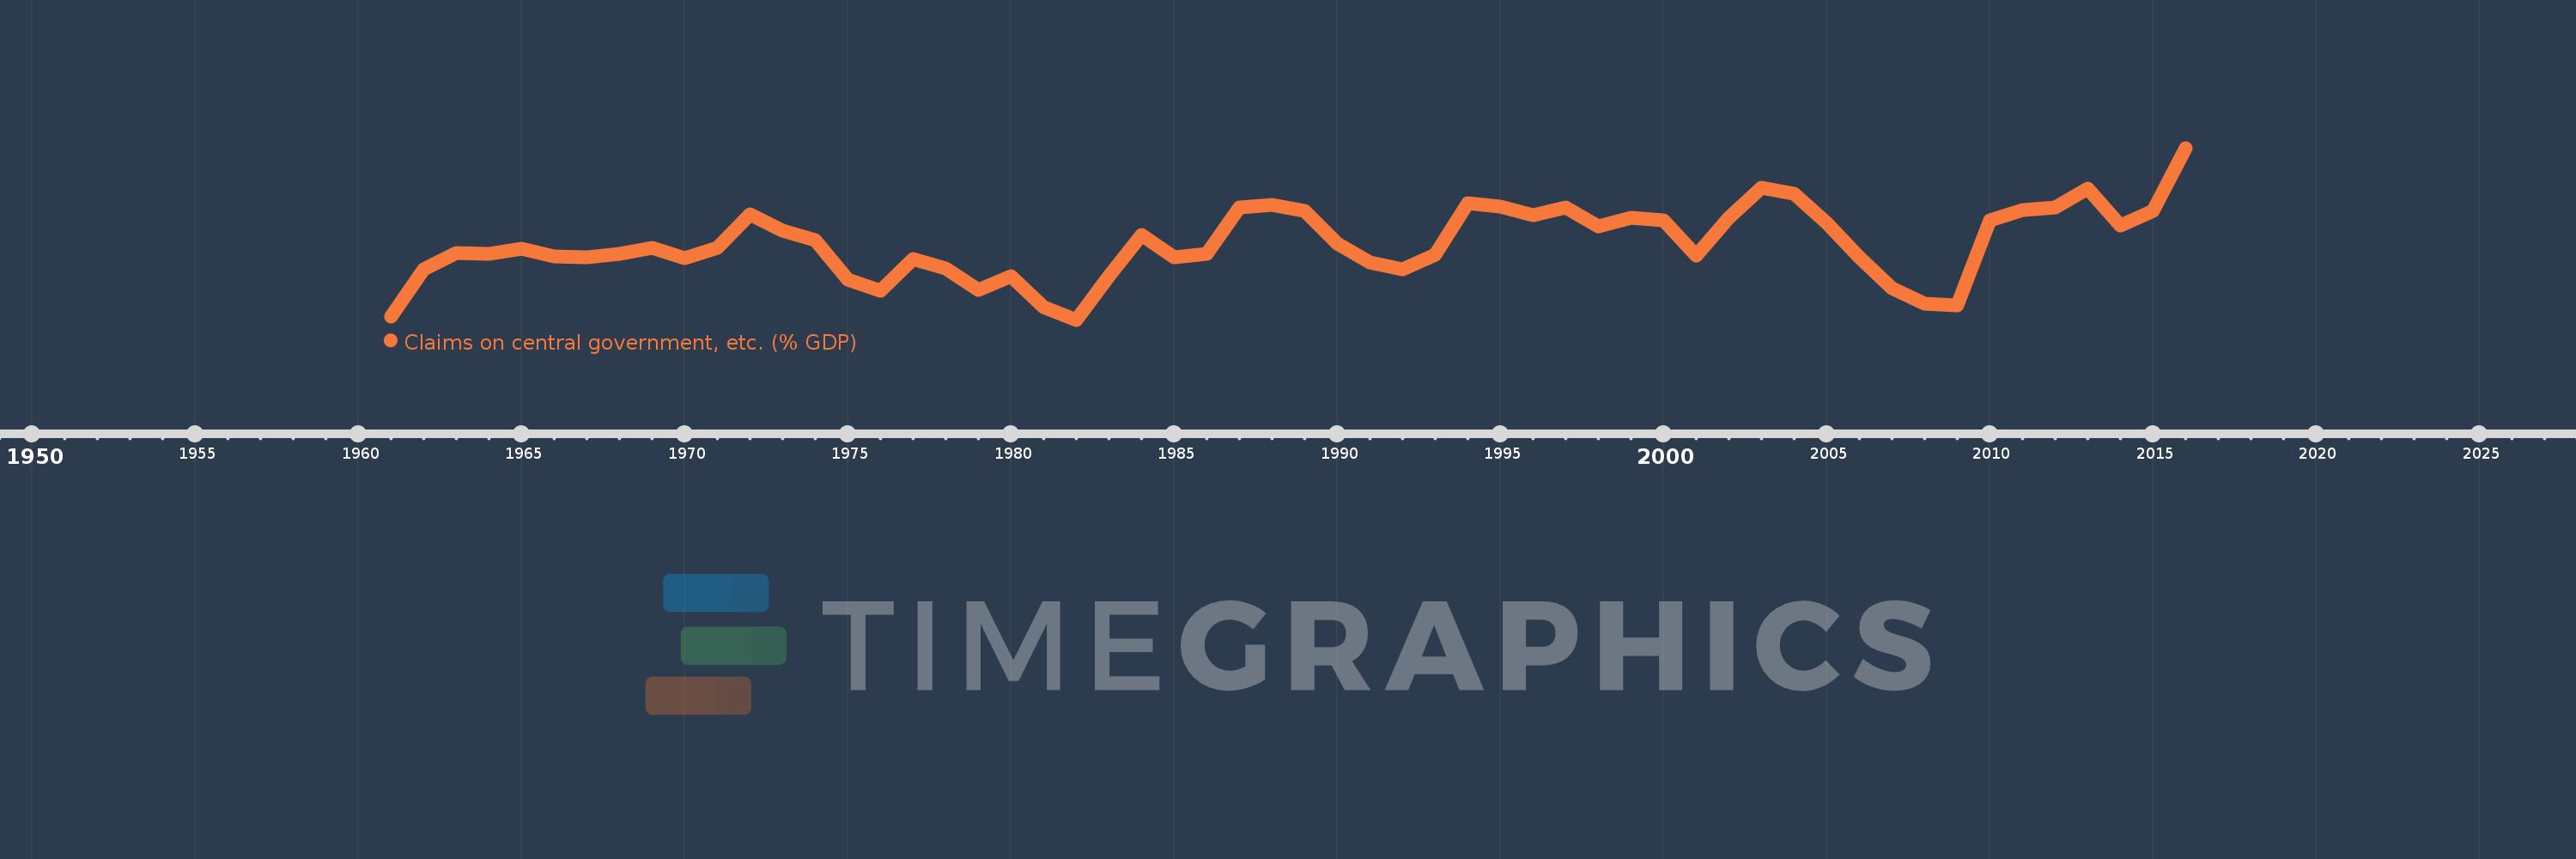
Claims on central government, etc. (% GDP)
2016,2015,2014,2013,2012,2011,2010,2009,2008,2007,2006,2005,2004,2003,2002,2001,2000,1999,1998,1997,1996,1995,1994,1993,1992,1991,1990,1989,1988,1987,1986,1985,1984,1983,1982,1981,1980,1979,1978,1977,1976,1975,1974,1973,1972,1971,1970,1969,1968,1967,1966,1965,1964,1963,1962,1961
This statistics in other country:
AfghanistanAlbaniaAlgeriaAngolaAntigua and BarbudaArab WorldArgentinaArmeniaArubaAustraliaAustriaAzerbaijanBahamas, TheBahrainBangladeshBarbadosBelarusBelgiumBelizeBeninBhutanBoliviaBosnia and HerzegovinaBotswanaBrazilBrunei DarussalamBulgariaBurkina FasoBurundiCabo VerdeCambodiaCameroonCanadaCaribbean small statesCentral African RepublicCentral Europe and the BalticsChadChileChinaColombiaComorosCongo, Dem. Rep.Congo, Rep.Costa RicaCote d'IvoireCroatiaCyprusCzech RepublicDenmarkDjiboutiDominicaDominican RepublicEarly-demographic dividendEast Asia & PacificEast Asia & Pacific (excluding high income)East Asia & Pacific (IDA & IBRD countries)EcuadorEgypt, Arab Rep.El SalvadorEquatorial GuineaEritreaEstoniaEthiopiaEuro areaEurope & Central AsiaEurope & Central Asia (excluding high income)Europe & Central Asia (IDA & IBRD countries)European UnionFijiFinlandFragile and conflict affected situationsFranceGabonGambia, TheGeorgiaGermanyGhanaGreeceGrenadaGuatemalaGuineaGuinea-BissauGuyanaHaitiHeavily indebted poor countries (HIPC)High incomeHondurasHong Kong SAR, ChinaHungaryIBRD onlyIcelandIDA & IBRD totalIDA blendIDA onlyIDA totalIndiaIndonesiaIran, Islamic Rep.IraqIrelandIsraelItalyJamaicaJapanJordanKazakhstanKenyaKorea, Rep.KosovoKuwaitKyrgyz RepublicLao PDRLate-demographic dividendLatin America & Caribbean Latin America & Caribbean (excluding high income)Latin America & the Caribbean (IDA & IBRD countries)LatviaLeast developed countries: UN classificationLebanonLesothoLiberiaLibyaLithuaniaLow & middle incomeLow incomeLower middle incomeLuxembourgMacao SAR, ChinaMacedonia, FYRMadagascarMalawiMalaysiaMaldivesMaliMaltaMauritaniaMauritiusMexicoMicronesia, Fed. Sts.Middle East & North AfricaMiddle East & North Africa (excluding high income)Middle East & North Africa (IDA & IBRD countries)Middle incomeMoldovaMongoliaMontenegroMoroccoMozambiqueMyanmarNamibiaNepalNetherlandsNew ZealandNicaraguaNigerNigeriaNorth AmericaNorwayOECD membersOmanOther small statesPacific island small statesPakistanPanamaPapua New GuineaParaguayPeruPhilippinesPolandPortugalPost-demographic dividendPre-demographic dividendQatarRomaniaRussian FederationRwandaSamoaSao Tome and PrincipeSaudi ArabiaSenegalSerbiaSeychellesSierra LeoneSingaporeSlovak RepublicSloveniaSmall statesSolomon IslandsSouth AfricaSouth AsiaSouth Asia (IDA & IBRD)South SudanSpainSri LankaSt. Kitts and NevisSt. LuciaSt. Vincent and the GrenadinesSub-Saharan Africa Sub-Saharan Africa (excluding high income)Sub-Saharan Africa (IDA & IBRD countries)SudanSurinameSwazilandSwedenSwitzerlandSyrian Arab RepublicTajikistanTanzaniaThailandTimor-LesteTogoTongaTrinidad and TobagoTunisiaTurkeyUgandaUkraineUnited Arab EmiratesUnited KingdomUnited StatesUpper middle incomeUruguayVanuatuVenezuela, RBVietnamWest Bank and GazaWorldYemen, Rep.ZambiaZimbabwe Timeline:
This timeline shows a graph from 1961 to 2016 of Small states. No data until 1960. Number of actual observations by date: 56.
Source name:
World Development Indicators
Source organization:
International Monetary Fund, International Financial Statistics and data files, and World Bank and OECD GDP estimates.
Categories, topics:
Financial Sector
Last updated:
apr 23, 2017
Indicators value changes by year
Minimum:
-3.207
jan 1, 1982
At the date of observation
Value
Absolute change
Change from previous value
jan 1, 1961
-2.951
-2.951
0.0%
jan 1, 1962
1.065
+4.016
-136.08%
jan 1, 1963
2.455
+1.39
130.53%
jan 1, 1964
2.414
-0.04
-1.65%
jan 1, 1965
2.87
+0.456
18.89%
jan 1, 1966
2.193
-0.677
-23.6%
jan 1, 1967
2.159
-0.034
-1.53%
jan 1, 1968
2.391
+0.232
10.73%
jan 1, 1969
2.896
+0.506
21.15%
jan 1, 1970
2.066
-0.831
-28.68%
jan 1, 1971
2.956
+0.891
43.11%
jan 1, 1972
5.765
+2.809
95.0%
jan 1, 1973
4.37
-1.395
-24.19%
jan 1, 1974
3.62
-0.75
-17.16%
jan 1, 1975
0.227
-3.394
-93.74%
jan 1, 1976
-0.749
-0.976
-430.6%
jan 1, 1977
1.957
+2.706
-361.21%
jan 1, 1978
1.198
-0.758
-38.76%
jan 1, 1979
-0.697
-1.896
-158.21%
jan 1, 1980
0.513
+1.211
-173.61%
jan 1, 1981
-2.106
-2.619
-510.15%
jan 1, 1982
-3.207
-1.101
52.3%
jan 1, 1983
0.529
+3.736
-116.5%
jan 1, 1984
4.013
+3.484
658.48%
jan 1, 1985
2.135
-1.878
-46.8%
jan 1, 1986
2.383
+0.249
11.65%
jan 1, 1987
6.357
+3.973
166.71%
jan 1, 1988
6.563
+0.207
3.25%
jan 1, 1989
6.111
-0.452
-6.89%
jan 1, 1990
3.281
-2.83
-46.31%
jan 1, 1991
1.658
-1.623
-49.47%
jan 1, 1992
1.113
-0.545
-32.88%
jan 1, 1993
2.364
+1.251
112.45%
jan 1, 1994
6.717
+4.353
184.11%
jan 1, 1995
6.419
-0.298
-4.44%
jan 1, 1996
5.736
-0.682
-10.63%
jan 1, 1997
6.374
+0.638
11.11%
jan 1, 1998
4.733
-1.641
-25.75%
jan 1, 1999
5.485
+0.752
15.9%
jan 1, 2000
5.314
-0.171
-3.12%
jan 1, 2001
2.288
-3.026
-56.94%
jan 1, 2002
5.484
+3.195
139.64%
jan 1, 2003
8.044
+2.56
46.68%
jan 1, 2004
7.544
-0.5
-6.21%
jan 1, 2005
5.047
-2.497
-33.09%
jan 1, 2006
2.16
-2.887
-57.2%
jan 1, 2007
-0.511
-2.671
-123.66%
jan 1, 2008
-1.845
-1.334
261.0%
jan 1, 2009
-1.949
-0.104
5.61%
jan 1, 2010
5.302
+7.251
-372.04%
jan 1, 2011
6.137
+0.835
15.75%
jan 1, 2012
6.388
+0.251
4.08%
jan 1, 2013
7.983
+1.595
24.97%
jan 1, 2014
4.823
-3.159
-39.58%
jan 1, 2015
6.085
+1.262
26.16%
jan 1, 2016
11.46
+5.375
88.33%
Ranking of countries by current statistics by years


Comments: