29
/
en
AIzaSyAYiBZKx7MnpbEhh9jyipgxe19OcubqV5w
April 1, 2024
178626
Liberia
LBR
true
2
1
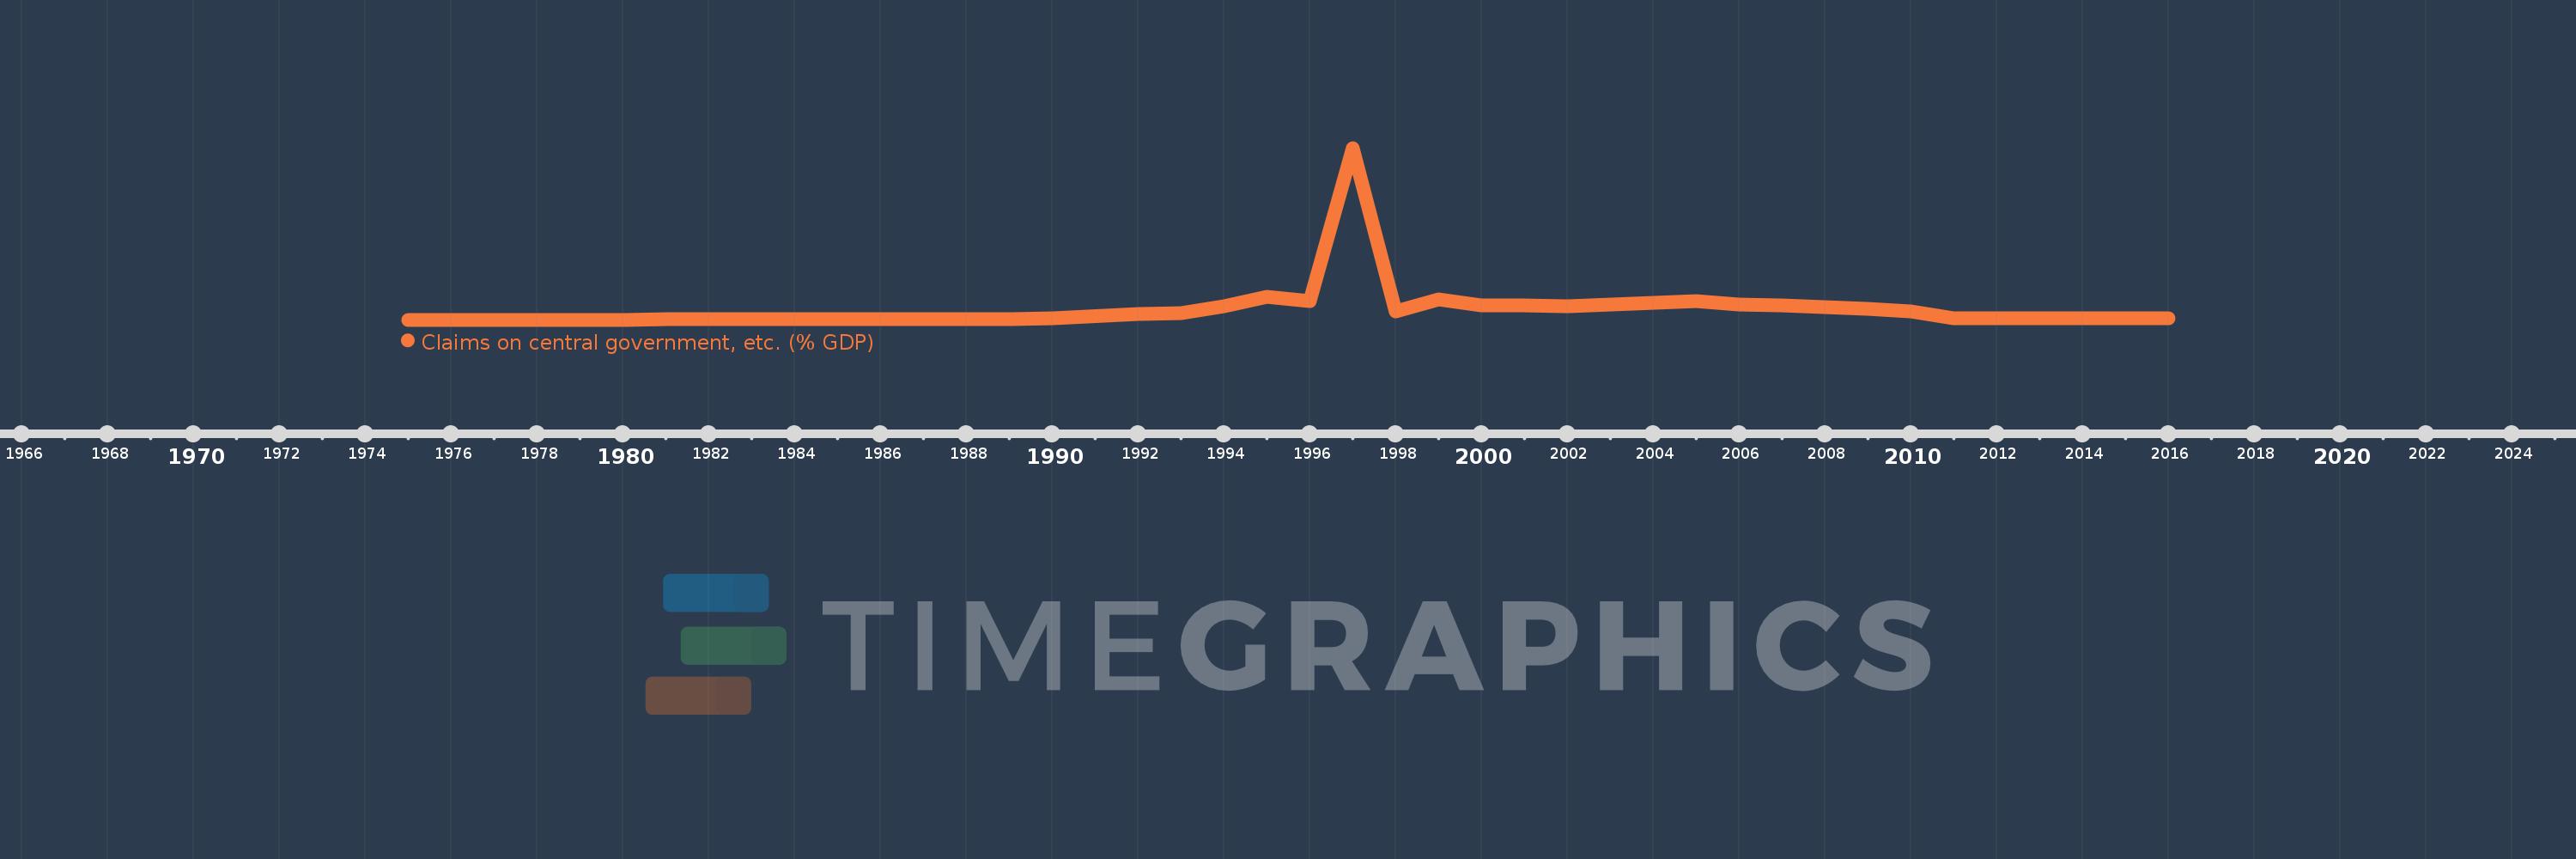
Claims on central government, etc. (% GDP)
2016,2015,2014,2013,2012,2011,2010,2009,2008,2007,2006,2005,2004,2003,2002,2001,2000,1999,1998,1997,1996,1995,1994,1993,1992,1990,1989,1988,1987,1986,1985,1984,1983,1982,1981,1980,1979,1978,1977,1976,1975
This statistics in other country:
AfghanistanAlbaniaAlgeriaAngolaAntigua and BarbudaArab WorldArgentinaArmeniaArubaAustraliaAustriaAzerbaijanBahamas, TheBahrainBangladeshBarbadosBelarusBelgiumBelizeBeninBhutanBoliviaBosnia and HerzegovinaBotswanaBrazilBrunei DarussalamBulgariaBurkina FasoBurundiCabo VerdeCambodiaCameroonCanadaCaribbean small statesCentral African RepublicCentral Europe and the BalticsChadChileChinaColombiaComorosCongo, Dem. Rep.Congo, Rep.Costa RicaCote d'IvoireCroatiaCyprusCzech RepublicDenmarkDjiboutiDominicaDominican RepublicEarly-demographic dividendEast Asia & PacificEast Asia & Pacific (excluding high income)East Asia & Pacific (IDA & IBRD countries)EcuadorEgypt, Arab Rep.El SalvadorEquatorial GuineaEritreaEstoniaEthiopiaEuro areaEurope & Central AsiaEurope & Central Asia (excluding high income)Europe & Central Asia (IDA & IBRD countries)European UnionFijiFinlandFragile and conflict affected situationsFranceGabonGambia, TheGeorgiaGermanyGhanaGreeceGrenadaGuatemalaGuineaGuinea-BissauGuyanaHaitiHeavily indebted poor countries (HIPC)High incomeHondurasHong Kong SAR, ChinaHungaryIBRD onlyIcelandIDA & IBRD totalIDA blendIDA onlyIDA totalIndiaIndonesiaIran, Islamic Rep.IraqIrelandIsraelItalyJamaicaJapanJordanKazakhstanKenyaKorea, Rep.KosovoKuwaitKyrgyz RepublicLao PDRLate-demographic dividendLatin America & Caribbean Latin America & Caribbean (excluding high income)Latin America & the Caribbean (IDA & IBRD countries)LatviaLeast developed countries: UN classificationLebanonLesothoLiberiaLibyaLithuaniaLow & middle incomeLow incomeLower middle incomeLuxembourgMacao SAR, ChinaMacedonia, FYRMadagascarMalawiMalaysiaMaldivesMaliMaltaMauritaniaMauritiusMexicoMicronesia, Fed. Sts.Middle East & North AfricaMiddle East & North Africa (excluding high income)Middle East & North Africa (IDA & IBRD countries)Middle incomeMoldovaMongoliaMontenegroMoroccoMozambiqueMyanmarNamibiaNepalNetherlandsNew ZealandNicaraguaNigerNigeriaNorth AmericaNorwayOECD membersOmanOther small statesPacific island small statesPakistanPanamaPapua New GuineaParaguayPeruPhilippinesPolandPortugalPost-demographic dividendPre-demographic dividendQatarRomaniaRussian FederationRwandaSamoaSao Tome and PrincipeSaudi ArabiaSenegalSerbiaSeychellesSierra LeoneSingaporeSlovak RepublicSloveniaSmall statesSolomon IslandsSouth AfricaSouth AsiaSouth Asia (IDA & IBRD)South SudanSpainSri LankaSt. Kitts and NevisSt. LuciaSt. Vincent and the GrenadinesSub-Saharan Africa Sub-Saharan Africa (excluding high income)Sub-Saharan Africa (IDA & IBRD countries)SudanSurinameSwazilandSwedenSwitzerlandSyrian Arab RepublicTajikistanTanzaniaThailandTimor-LesteTogoTongaTrinidad and TobagoTunisiaTurkeyUgandaUkraineUnited Arab EmiratesUnited KingdomUnited StatesUpper middle incomeUruguayVanuatuVenezuela, RBVietnamWest Bank and GazaWorldYemen, Rep.ZambiaZimbabwe Timeline:
This timeline shows a graph from 1975 to 2016 of Liberia. No data until 1974. Number of actual observations by date: 41.
Source name:
World Development Indicators
Source organization:
International Monetary Fund, International Financial Statistics and data files, and World Bank and OECD GDP estimates.
Categories, topics:
Financial Sector
Last updated:
apr 23, 2017
Indicators value changes by year
Maximum:
2.056K
jan 1, 1997
At the date of observation
Value
Absolute change
Change from previous value
jan 1, 1975
0.143
+0.143
0.0%
jan 1, 1976
0.038
-0.105
-73.62%
jan 1, 1977
0.054
+0.016
43.67%
jan 1, 1978
0.048
-0.007
-12.01%
jan 1, 1979
0.186
+0.138
290.08%
jan 1, 1980
0.244
+0.058
31.4%
jan 1, 1981
4.316
+4.071
1.67K%
jan 1, 1982
4.198
-0.117
-2.72%
jan 1, 1983
4.426
+0.228
5.42%
jan 1, 1984
4.796
+0.37
8.35%
jan 1, 1985
4.414
-0.381
-7.95%
jan 1, 1986
6.573
+2.159
48.92%
jan 1, 1987
8.381
+1.807
27.49%
jan 1, 1988
9.943
+1.563
18.64%
jan 1, 1989
11.122
+1.178
11.85%
jan 1, 1990
18.705
+7.583
68.18%
jan 1, 1992
67.214
+48.509
259.34%
jan 1, 1993
75.503
+8.289
12.33%
jan 1, 1994
164.485
+88.982
117.85%
jan 1, 1995
279.312
+114.827
69.81%
jan 1, 1996
226.051
-53.261
-19.07%
jan 1, 1997
2.056K
+1.83K
809.34%
jan 1, 1998
95.177
-1.96K
-95.37%
jan 1, 1999
239.472
+144.294
151.61%
jan 1, 2000
176.782
-62.69
-26.18%
jan 1, 2001
170.426
-6.356
-3.6%
jan 1, 2002
166.35
-4.076
-2.39%
jan 1, 2003
179.792
+13.442
8.08%
jan 1, 2004
205.614
+25.822
14.36%
jan 1, 2005
220.325
+14.711
7.15%
jan 1, 2006
181.181
-39.144
-17.77%
jan 1, 2007
176.314
-4.867
-2.69%
jan 1, 2008
149.303
-27.011
-15.32%
jan 1, 2009
130.734
-18.569
-12.44%
jan 1, 2010
99.582
-31.152
-23.83%
jan 1, 2011
16.453
-83.129
-83.48%
jan 1, 2012
17.452
+0.999
6.07%
jan 1, 2013
16.496
-0.956
-5.48%
jan 1, 2014
16.883
+0.388
2.35%
jan 1, 2015
16.318
-0.565
-3.35%
jan 1, 2016
14.04
-2.278
-13.96%
Ranking of countries by current statistics by years


Comments: