29
/
en
AIzaSyAYiBZKx7MnpbEhh9jyipgxe19OcubqV5w
April 1, 2024
77962
Bangladesh
BGD
true
2
1
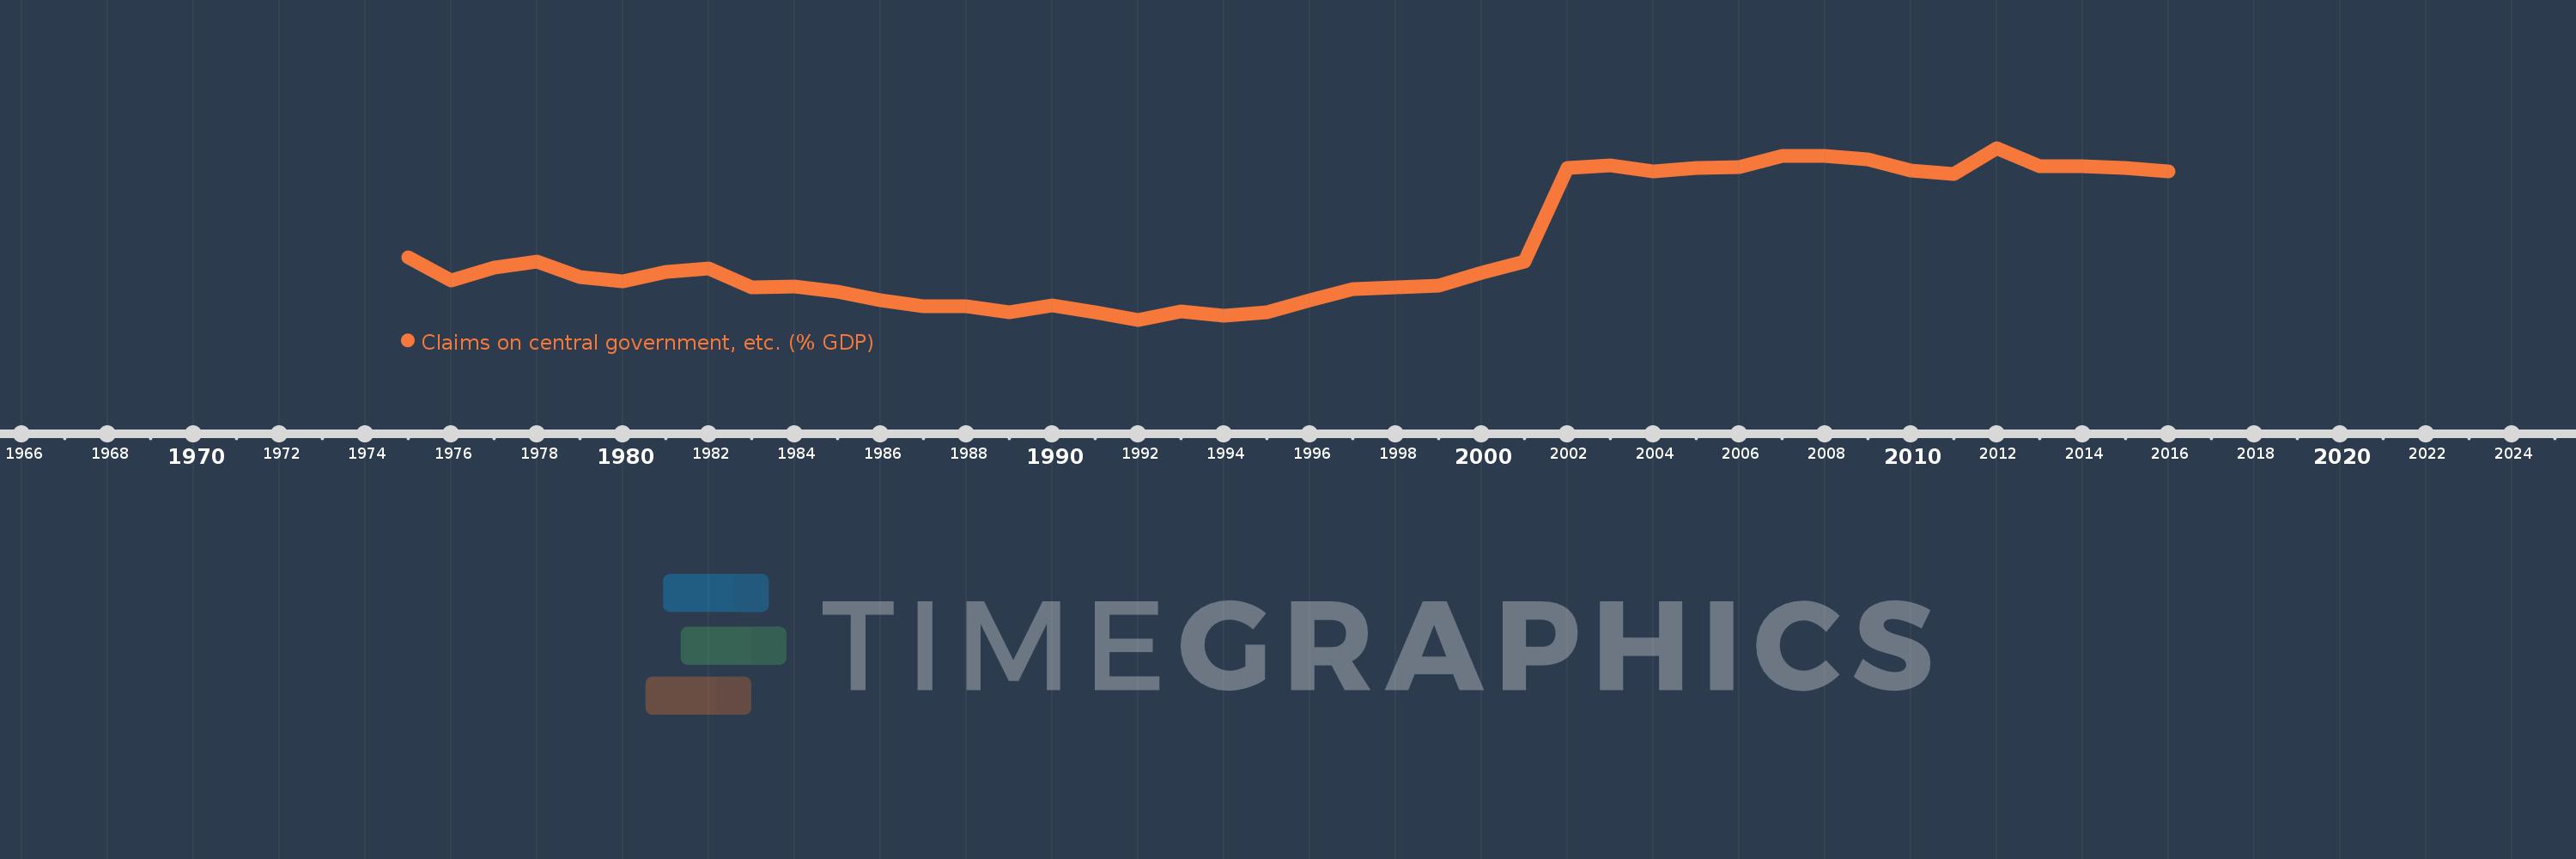
Claims on central government, etc. (% GDP)
2016,2015,2014,2013,2012,2011,2010,2009,2008,2007,2006,2005,2004,2003,2002,2001,2000,1999,1998,1997,1996,1995,1994,1993,1992,1991,1990,1989,1988,1987,1986,1985,1984,1983,1982,1981,1980,1979,1978,1977,1976,1975
This statistics in other country:
AfghanistanAlbaniaAlgeriaAngolaAntigua and BarbudaArab WorldArgentinaArmeniaArubaAustraliaAustriaAzerbaijanBahamas, TheBahrainBangladeshBarbadosBelarusBelgiumBelizeBeninBhutanBoliviaBosnia and HerzegovinaBotswanaBrazilBrunei DarussalamBulgariaBurkina FasoBurundiCabo VerdeCambodiaCameroonCanadaCaribbean small statesCentral African RepublicCentral Europe and the BalticsChadChileChinaColombiaComorosCongo, Dem. Rep.Congo, Rep.Costa RicaCote d'IvoireCroatiaCyprusCzech RepublicDenmarkDjiboutiDominicaDominican RepublicEarly-demographic dividendEast Asia & PacificEast Asia & Pacific (excluding high income)East Asia & Pacific (IDA & IBRD countries)EcuadorEgypt, Arab Rep.El SalvadorEquatorial GuineaEritreaEstoniaEthiopiaEuro areaEurope & Central AsiaEurope & Central Asia (excluding high income)Europe & Central Asia (IDA & IBRD countries)European UnionFijiFinlandFragile and conflict affected situationsFranceGabonGambia, TheGeorgiaGermanyGhanaGreeceGrenadaGuatemalaGuineaGuinea-BissauGuyanaHaitiHeavily indebted poor countries (HIPC)High incomeHondurasHong Kong SAR, ChinaHungaryIBRD onlyIcelandIDA & IBRD totalIDA blendIDA onlyIDA totalIndiaIndonesiaIran, Islamic Rep.IraqIrelandIsraelItalyJamaicaJapanJordanKazakhstanKenyaKorea, Rep.KosovoKuwaitKyrgyz RepublicLao PDRLate-demographic dividendLatin America & Caribbean Latin America & Caribbean (excluding high income)Latin America & the Caribbean (IDA & IBRD countries)LatviaLeast developed countries: UN classificationLebanonLesothoLiberiaLibyaLithuaniaLow & middle incomeLow incomeLower middle incomeLuxembourgMacao SAR, ChinaMacedonia, FYRMadagascarMalawiMalaysiaMaldivesMaliMaltaMauritaniaMauritiusMexicoMicronesia, Fed. Sts.Middle East & North AfricaMiddle East & North Africa (excluding high income)Middle East & North Africa (IDA & IBRD countries)Middle incomeMoldovaMongoliaMontenegroMoroccoMozambiqueMyanmarNamibiaNepalNetherlandsNew ZealandNicaraguaNigerNigeriaNorth AmericaNorwayOECD membersOmanOther small statesPacific island small statesPakistanPanamaPapua New GuineaParaguayPeruPhilippinesPolandPortugalPost-demographic dividendPre-demographic dividendQatarRomaniaRussian FederationRwandaSamoaSao Tome and PrincipeSaudi ArabiaSenegalSerbiaSeychellesSierra LeoneSingaporeSlovak RepublicSloveniaSmall statesSolomon IslandsSouth AfricaSouth AsiaSouth Asia (IDA & IBRD)South SudanSpainSri LankaSt. Kitts and NevisSt. LuciaSt. Vincent and the GrenadinesSub-Saharan Africa Sub-Saharan Africa (excluding high income)Sub-Saharan Africa (IDA & IBRD countries)SudanSurinameSwazilandSwedenSwitzerlandSyrian Arab RepublicTajikistanTanzaniaThailandTimor-LesteTogoTongaTrinidad and TobagoTunisiaTurkeyUgandaUkraineUnited Arab EmiratesUnited KingdomUnited StatesUpper middle incomeUruguayVanuatuVenezuela, RBVietnamWest Bank and GazaWorldYemen, Rep.ZambiaZimbabwe Timeline:
This timeline shows a graph from 1975 to 2016 of Bangladesh. No data until 1974. Number of actual observations by date: 42.
Source name:
World Development Indicators
Source organization:
International Monetary Fund, International Financial Statistics and data files, and World Bank and OECD GDP estimates.
Categories, topics:
Financial Sector
Last updated:
apr 23, 2017
Indicators value changes by year
Minimum:
-0.174
jan 1, 1992
Maximum:
16.366
jan 1, 2012
At the date of observation
Value
Absolute change
Change from previous value
jan 1, 1975
5.87
+5.87
0.0%
jan 1, 1976
3.591
-2.279
-38.82%
jan 1, 1977
4.844
+1.253
34.89%
jan 1, 1978
5.44
+0.596
12.29%
jan 1, 1979
3.942
-1.498
-27.53%
jan 1, 1980
3.509
-0.434
-11.0%
jan 1, 1981
4.41
+0.901
25.68%
jan 1, 1982
4.796
+0.386
8.76%
jan 1, 1983
2.916
-1.88
-39.21%
jan 1, 1984
3.012
+0.096
3.3%
jan 1, 1985
2.532
-0.48
-15.92%
jan 1, 1986
1.718
-0.814
-32.15%
jan 1, 1987
1.102
-0.616
-35.84%
jan 1, 1988
1.11
+0.007
0.66%
jan 1, 1989
0.538
-0.572
-51.51%
jan 1, 1990
1.18
+0.642
119.35%
jan 1, 1991
0.505
-0.675
-57.18%
jan 1, 1992
-0.174
-0.68
-134.52%
jan 1, 1993
0.623
+0.797
-456.91%
jan 1, 1994
0.239
-0.384
-61.61%
jan 1, 1995
0.57
+0.331
138.55%
jan 1, 1996
1.727
+1.157
202.84%
jan 1, 1997
2.742
+1.015
58.78%
jan 1, 1998
2.924
+0.182
6.64%
jan 1, 1999
3.074
+0.15
5.14%
jan 1, 2000
4.339
+1.264
41.12%
jan 1, 2001
5.412
+1.073
24.74%
jan 1, 2002
14.42
+9.008
166.44%
jan 1, 2003
14.675
+0.256
1.77%
jan 1, 2004
14.104
-0.571
-3.89%
jan 1, 2005
14.426
+0.321
2.28%
jan 1, 2006
14.549
+0.123
0.85%
jan 1, 2007
15.58
+1.032
7.09%
jan 1, 2008
15.606
+0.026
0.16%
jan 1, 2009
15.229
-0.376
-2.41%
jan 1, 2010
14.189
-1.04
-6.83%
jan 1, 2011
13.857
-0.332
-2.34%
jan 1, 2012
16.366
+2.508
18.1%
jan 1, 2013
14.626
-1.74
-10.63%
jan 1, 2014
14.645
+0.019
0.13%
jan 1, 2015
14.435
-0.21
-1.43%
jan 1, 2016
14.131
-0.304
-2.11%
Ranking of countries by current statistics by years


Comments: