29
/
en
AIzaSyAYiBZKx7MnpbEhh9jyipgxe19OcubqV5w
April 1, 2024
252788
Sudan
SDN
true
2
1
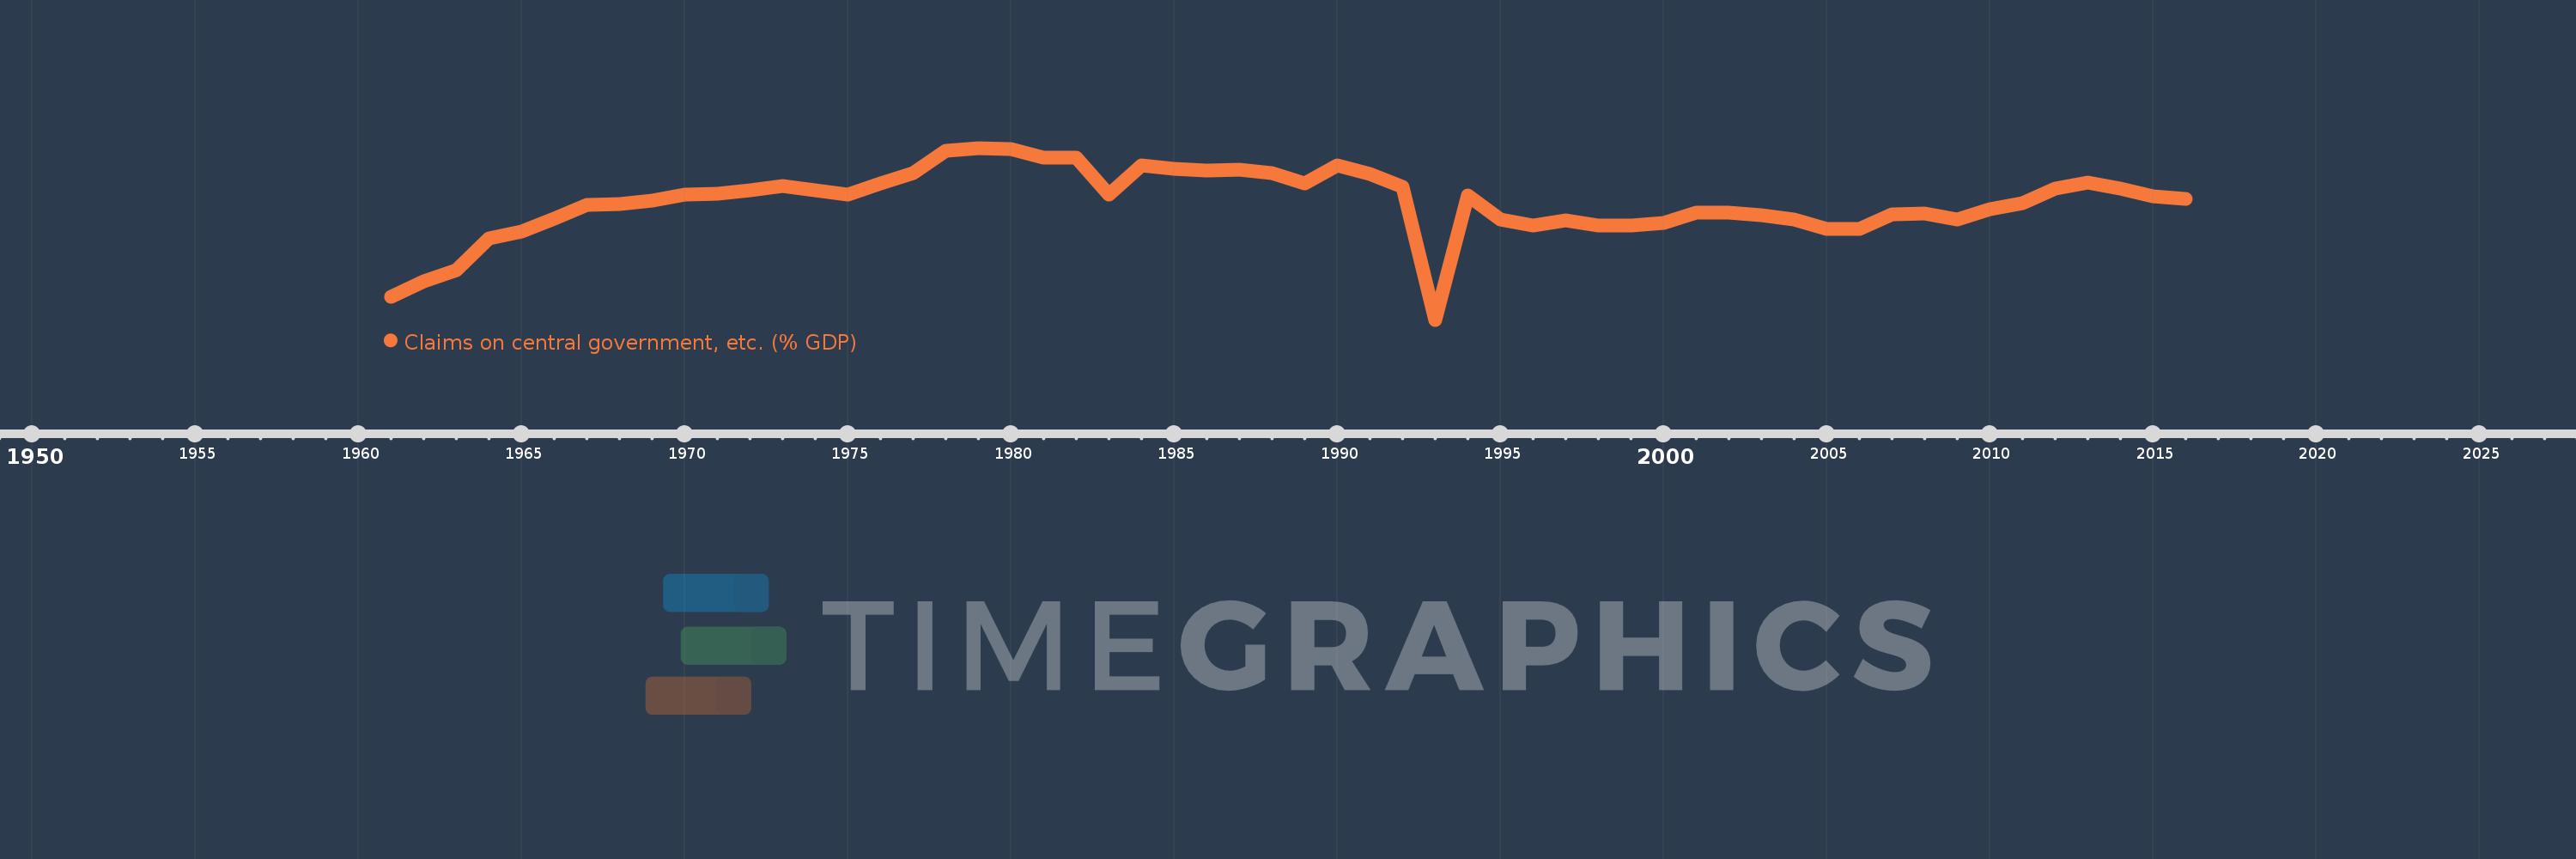
Claims on central government, etc. (% GDP)
2016,2015,2014,2013,2012,2011,2010,2009,2008,2007,2006,2005,2004,2003,2002,2001,2000,1999,1998,1997,1996,1995,1994,1993,1992,1991,1990,1989,1988,1987,1986,1985,1984,1983,1982,1981,1980,1979,1978,1977,1976,1975,1974,1973,1972,1971,1970,1969,1968,1967,1966,1965,1964,1963,1962,1961
This statistics in other country:
AfghanistanAlbaniaAlgeriaAngolaAntigua and BarbudaArab WorldArgentinaArmeniaArubaAustraliaAustriaAzerbaijanBahamas, TheBahrainBangladeshBarbadosBelarusBelgiumBelizeBeninBhutanBoliviaBosnia and HerzegovinaBotswanaBrazilBrunei DarussalamBulgariaBurkina FasoBurundiCabo VerdeCambodiaCameroonCanadaCaribbean small statesCentral African RepublicCentral Europe and the BalticsChadChileChinaColombiaComorosCongo, Dem. Rep.Congo, Rep.Costa RicaCote d'IvoireCroatiaCyprusCzech RepublicDenmarkDjiboutiDominicaDominican RepublicEarly-demographic dividendEast Asia & PacificEast Asia & Pacific (excluding high income)East Asia & Pacific (IDA & IBRD countries)EcuadorEgypt, Arab Rep.El SalvadorEquatorial GuineaEritreaEstoniaEthiopiaEuro areaEurope & Central AsiaEurope & Central Asia (excluding high income)Europe & Central Asia (IDA & IBRD countries)European UnionFijiFinlandFragile and conflict affected situationsFranceGabonGambia, TheGeorgiaGermanyGhanaGreeceGrenadaGuatemalaGuineaGuinea-BissauGuyanaHaitiHeavily indebted poor countries (HIPC)High incomeHondurasHong Kong SAR, ChinaHungaryIBRD onlyIcelandIDA & IBRD totalIDA blendIDA onlyIDA totalIndiaIndonesiaIran, Islamic Rep.IraqIrelandIsraelItalyJamaicaJapanJordanKazakhstanKenyaKorea, Rep.KosovoKuwaitKyrgyz RepublicLao PDRLate-demographic dividendLatin America & Caribbean Latin America & Caribbean (excluding high income)Latin America & the Caribbean (IDA & IBRD countries)LatviaLeast developed countries: UN classificationLebanonLesothoLiberiaLibyaLithuaniaLow & middle incomeLow incomeLower middle incomeLuxembourgMacao SAR, ChinaMacedonia, FYRMadagascarMalawiMalaysiaMaldivesMaliMaltaMauritaniaMauritiusMexicoMicronesia, Fed. Sts.Middle East & North AfricaMiddle East & North Africa (excluding high income)Middle East & North Africa (IDA & IBRD countries)Middle incomeMoldovaMongoliaMontenegroMoroccoMozambiqueMyanmarNamibiaNepalNetherlandsNew ZealandNicaraguaNigerNigeriaNorth AmericaNorwayOECD membersOmanOther small statesPacific island small statesPakistanPanamaPapua New GuineaParaguayPeruPhilippinesPolandPortugalPost-demographic dividendPre-demographic dividendQatarRomaniaRussian FederationRwandaSamoaSao Tome and PrincipeSaudi ArabiaSenegalSerbiaSeychellesSierra LeoneSingaporeSlovak RepublicSloveniaSmall statesSolomon IslandsSouth AfricaSouth AsiaSouth Asia (IDA & IBRD)South SudanSpainSri LankaSt. Kitts and NevisSt. LuciaSt. Vincent and the GrenadinesSub-Saharan Africa Sub-Saharan Africa (excluding high income)Sub-Saharan Africa (IDA & IBRD countries)SudanSurinameSwazilandSwedenSwitzerlandSyrian Arab RepublicTajikistanTanzaniaThailandTimor-LesteTogoTongaTrinidad and TobagoTunisiaTurkeyUgandaUkraineUnited Arab EmiratesUnited KingdomUnited StatesUpper middle incomeUruguayVanuatuVenezuela, RBVietnamWest Bank and GazaWorldYemen, Rep.ZambiaZimbabwe Timeline:
This timeline shows a graph from 1961 to 2016 of Sudan. No data until 1960. Number of actual observations by date: 56.
Source name:
World Development Indicators
Source organization:
International Monetary Fund, International Financial Statistics and data files, and World Bank and OECD GDP estimates.
Categories, topics:
Financial Sector
Last updated:
apr 23, 2017
Indicators value changes by year
Minimum:
-16.548
jan 1, 1993
Maximum:
19.323
jan 1, 1979
At the date of observation
Value
Absolute change
Change from previous value
jan 1, 1961
-11.698
-11.698
0.0%
jan 1, 1962
-8.509
+3.189
-27.26%
jan 1, 1963
-6.121
+2.388
-28.06%
jan 1, 1964
0.451
+6.572
-107.36%
jan 1, 1965
1.907
+1.457
323.3%
jan 1, 1966
4.619
+2.712
142.17%
jan 1, 1967
7.381
+2.762
59.79%
jan 1, 1968
7.575
+0.195
2.64%
jan 1, 1969
8.276
+0.701
9.25%
jan 1, 1970
9.562
+1.285
15.53%
jan 1, 1971
9.837
+0.276
2.88%
jan 1, 1972
10.538
+0.701
7.13%
jan 1, 1973
11.322
+0.784
7.44%
jan 1, 1974
10.496
-0.826
-7.3%
jan 1, 1975
9.546
-0.95
-9.05%
jan 1, 1976
11.899
+2.354
24.66%
jan 1, 1977
14.024
+2.125
17.86%
jan 1, 1978
18.681
+4.657
33.21%
jan 1, 1979
19.323
+0.642
3.44%
jan 1, 1980
19.027
-0.296
-1.53%
jan 1, 1981
17.358
-1.67
-8.77%
jan 1, 1982
17.247
-0.111
-0.64%
jan 1, 1983
9.515
-7.732
-44.83%
jan 1, 1984
15.697
+6.181
64.96%
jan 1, 1985
14.906
-0.791
-5.04%
jan 1, 1986
14.669
-0.237
-1.59%
jan 1, 1987
14.795
+0.126
0.86%
jan 1, 1988
14.096
-0.699
-4.72%
jan 1, 1989
11.917
-2.179
-15.46%
jan 1, 1990
15.613
+3.696
31.02%
jan 1, 1991
13.943
-1.67
-10.7%
jan 1, 1992
11.137
-2.807
-20.13%
jan 1, 1993
-16.548
-27.685
-248.6%
jan 1, 1994
9.386
+25.935
-156.72%
jan 1, 1995
4.376
-5.01
-53.37%
jan 1, 1996
3.126
-1.25
-28.56%
jan 1, 1997
4.213
+1.087
34.76%
jan 1, 1998
3.113
-1.1
-26.12%
jan 1, 1999
3.179
+0.066
2.12%
jan 1, 2000
3.663
+0.484
15.23%
jan 1, 2001
5.856
+2.193
59.88%
jan 1, 2002
5.902
+0.046
0.78%
jan 1, 2003
5.303
-0.599
-10.15%
jan 1, 2004
4.347
-0.956
-18.03%
jan 1, 2005
2.392
-1.955
-44.97%
jan 1, 2006
2.399
+0.007
0.28%
jan 1, 2007
5.508
+3.109
129.63%
jan 1, 2008
5.61
+0.102
1.85%
jan 1, 2009
4.394
-1.216
-21.67%
jan 1, 2010
6.609
+2.215
50.42%
jan 1, 2011
7.762
+1.153
17.45%
jan 1, 2012
10.75
+2.988
38.49%
jan 1, 2013
12.181
+1.431
13.31%
jan 1, 2014
10.824
-1.357
-11.14%
jan 1, 2015
9.221
-1.602
-14.81%
jan 1, 2016
8.751
-0.471
-5.1%
Ranking of countries by current statistics by years


Comments: