29
/
en
AIzaSyAYiBZKx7MnpbEhh9jyipgxe19OcubqV5w
April 1, 2024
120720
Dominica
DMA
true
2
1
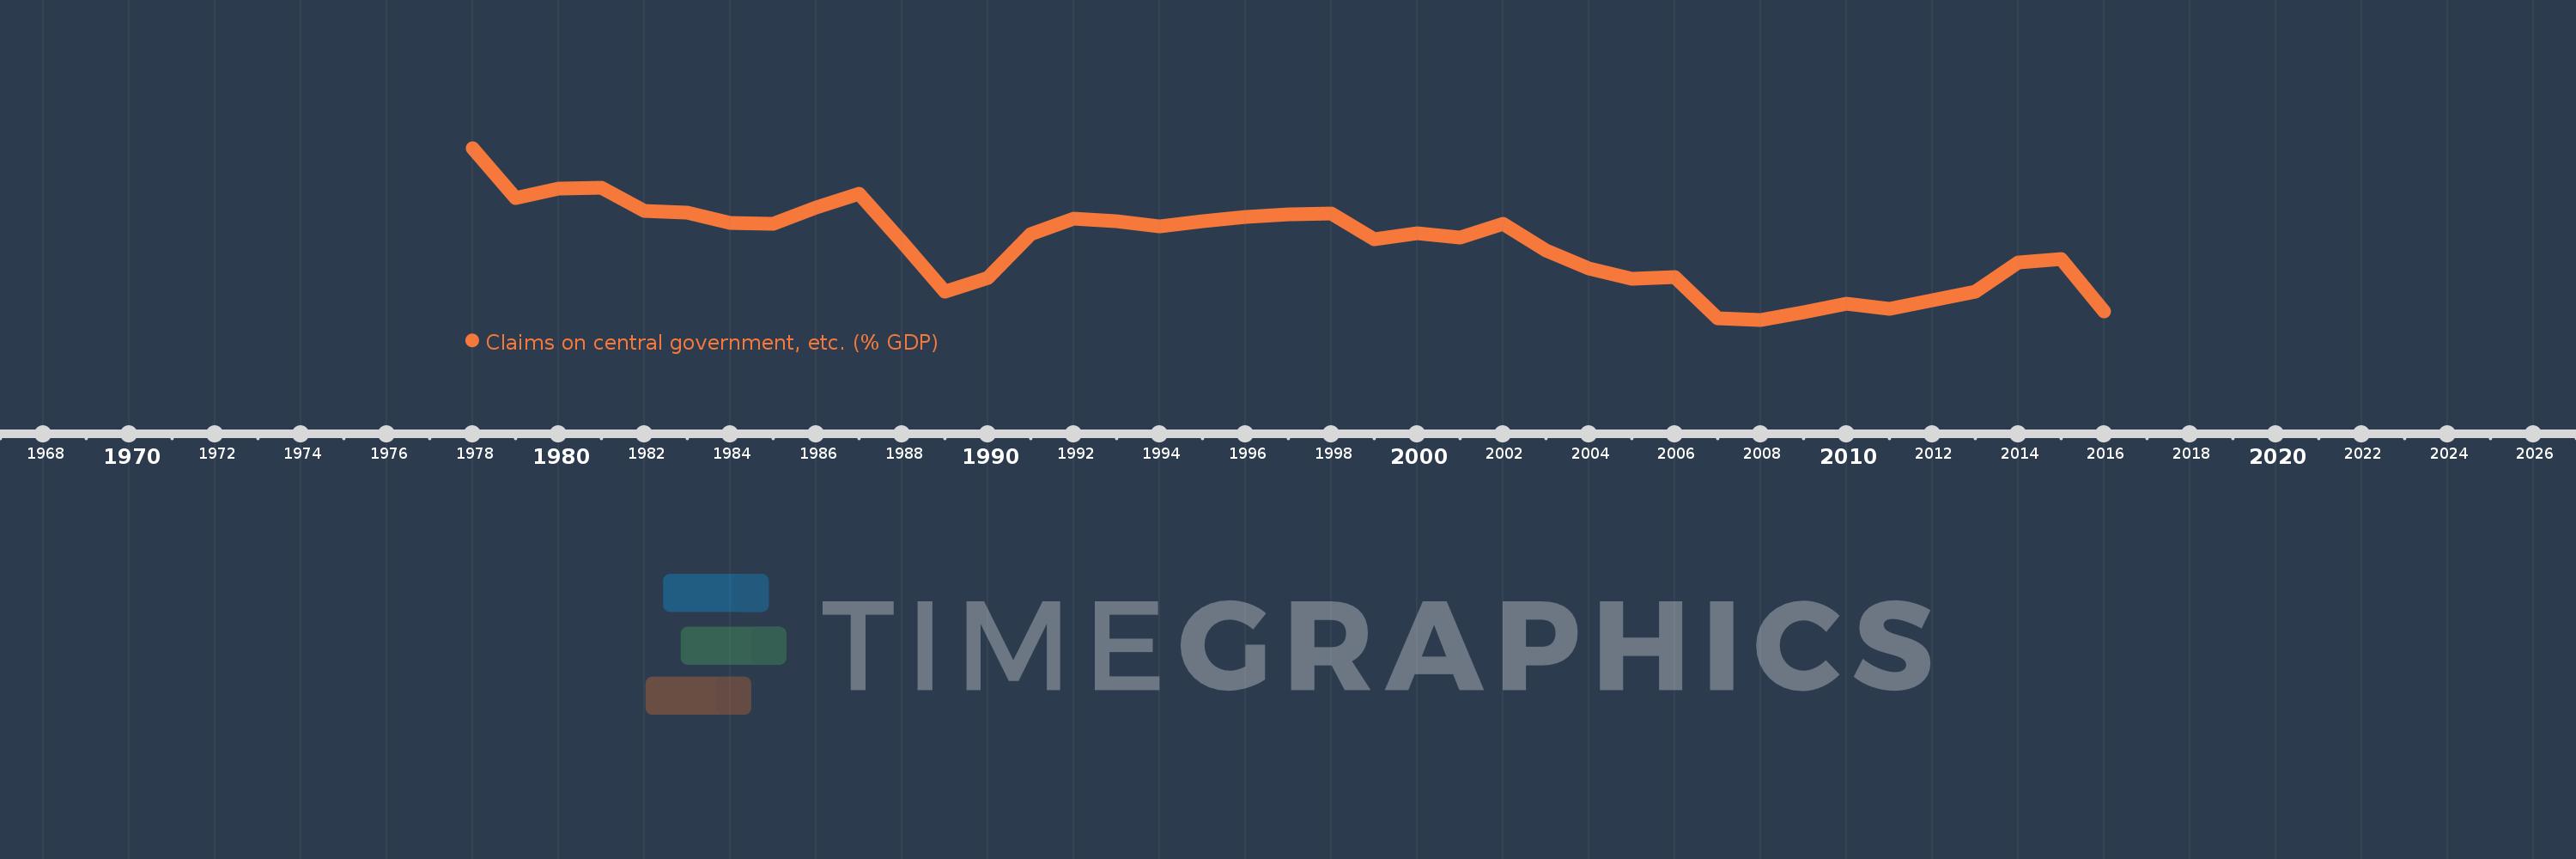
Claims on central government, etc. (% GDP)
2016,2015,2014,2013,2012,2011,2010,2009,2008,2007,2006,2005,2004,2003,2002,2001,2000,1999,1998,1997,1996,1995,1994,1993,1992,1991,1990,1989,1988,1987,1986,1985,1984,1983,1982,1981,1980,1979,1978
This statistics in other country:
AfghanistanAlbaniaAlgeriaAngolaAntigua and BarbudaArab WorldArgentinaArmeniaArubaAustraliaAustriaAzerbaijanBahamas, TheBahrainBangladeshBarbadosBelarusBelgiumBelizeBeninBhutanBoliviaBosnia and HerzegovinaBotswanaBrazilBrunei DarussalamBulgariaBurkina FasoBurundiCabo VerdeCambodiaCameroonCanadaCaribbean small statesCentral African RepublicCentral Europe and the BalticsChadChileChinaColombiaComorosCongo, Dem. Rep.Congo, Rep.Costa RicaCote d'IvoireCroatiaCyprusCzech RepublicDenmarkDjiboutiDominicaDominican RepublicEarly-demographic dividendEast Asia & PacificEast Asia & Pacific (excluding high income)East Asia & Pacific (IDA & IBRD countries)EcuadorEgypt, Arab Rep.El SalvadorEquatorial GuineaEritreaEstoniaEthiopiaEuro areaEurope & Central AsiaEurope & Central Asia (excluding high income)Europe & Central Asia (IDA & IBRD countries)European UnionFijiFinlandFragile and conflict affected situationsFranceGabonGambia, TheGeorgiaGermanyGhanaGreeceGrenadaGuatemalaGuineaGuinea-BissauGuyanaHaitiHeavily indebted poor countries (HIPC)High incomeHondurasHong Kong SAR, ChinaHungaryIBRD onlyIcelandIDA & IBRD totalIDA blendIDA onlyIDA totalIndiaIndonesiaIran, Islamic Rep.IraqIrelandIsraelItalyJamaicaJapanJordanKazakhstanKenyaKorea, Rep.KosovoKuwaitKyrgyz RepublicLao PDRLate-demographic dividendLatin America & Caribbean Latin America & Caribbean (excluding high income)Latin America & the Caribbean (IDA & IBRD countries)LatviaLeast developed countries: UN classificationLebanonLesothoLiberiaLibyaLithuaniaLow & middle incomeLow incomeLower middle incomeLuxembourgMacao SAR, ChinaMacedonia, FYRMadagascarMalawiMalaysiaMaldivesMaliMaltaMauritaniaMauritiusMexicoMicronesia, Fed. Sts.Middle East & North AfricaMiddle East & North Africa (excluding high income)Middle East & North Africa (IDA & IBRD countries)Middle incomeMoldovaMongoliaMontenegroMoroccoMozambiqueMyanmarNamibiaNepalNetherlandsNew ZealandNicaraguaNigerNigeriaNorth AmericaNorwayOECD membersOmanOther small statesPacific island small statesPakistanPanamaPapua New GuineaParaguayPeruPhilippinesPolandPortugalPost-demographic dividendPre-demographic dividendQatarRomaniaRussian FederationRwandaSamoaSao Tome and PrincipeSaudi ArabiaSenegalSerbiaSeychellesSierra LeoneSingaporeSlovak RepublicSloveniaSmall statesSolomon IslandsSouth AfricaSouth AsiaSouth Asia (IDA & IBRD)South SudanSpainSri LankaSt. Kitts and NevisSt. LuciaSt. Vincent and the GrenadinesSub-Saharan Africa Sub-Saharan Africa (excluding high income)Sub-Saharan Africa (IDA & IBRD countries)SudanSurinameSwazilandSwedenSwitzerlandSyrian Arab RepublicTajikistanTanzaniaThailandTimor-LesteTogoTongaTrinidad and TobagoTunisiaTurkeyUgandaUkraineUnited Arab EmiratesUnited KingdomUnited StatesUpper middle incomeUruguayVanuatuVenezuela, RBVietnamWest Bank and GazaWorldYemen, Rep.ZambiaZimbabwe Timeline:
This timeline shows a graph from 1978 to 2016 of Dominica. No data until 1977. Number of actual observations by date: 39.
Source name:
World Development Indicators
Source organization:
International Monetary Fund, International Financial Statistics and data files, and World Bank and OECD GDP estimates.
Categories, topics:
Financial Sector
Last updated:
apr 23, 2017
Indicators value changes by year
Minimum:
-4.625
jan 1, 2008
Maximum:
21.015
jan 1, 1978
At the date of observation
Value
Absolute change
Change from previous value
jan 1, 1978
21.015
+21.015
0.0%
jan 1, 1979
13.495
-7.521
-35.79%
jan 1, 1980
14.895
+1.4
10.37%
jan 1, 1981
15.094
+0.2
1.34%
jan 1, 1982
11.64
-3.454
-22.88%
jan 1, 1983
11.349
-0.291
-2.5%
jan 1, 1984
9.848
-1.501
-13.22%
jan 1, 1985
9.732
-0.117
-1.19%
jan 1, 1986
12.14
+2.408
24.75%
jan 1, 1987
14.24
+2.1
17.3%
jan 1, 1988
7.004
-7.236
-50.82%
jan 1, 1989
-0.432
-7.436
-106.17%
jan 1, 1990
1.592
+2.024
-468.4%
jan 1, 1991
8.109
+6.517
409.47%
jan 1, 1992
10.457
+2.348
28.96%
jan 1, 1993
10.07
-0.387
-3.7%
jan 1, 1994
9.305
-0.764
-7.59%
jan 1, 1995
10.044
+0.738
7.93%
jan 1, 1996
10.781
+0.737
7.34%
jan 1, 1997
11.083
+0.302
2.8%
jan 1, 1998
11.211
+0.128
1.16%
jan 1, 1999
7.383
-3.828
-34.14%
jan 1, 2000
8.252
+0.869
11.77%
jan 1, 2001
7.663
-0.589
-7.13%
jan 1, 2002
9.733
+2.069
27.0%
jan 1, 2003
5.702
-4.031
-41.42%
jan 1, 2004
2.982
-2.72
-47.7%
jan 1, 2005
1.477
-1.505
-50.48%
jan 1, 2006
1.779
+0.302
20.45%
jan 1, 2007
-4.377
-6.156
-346.12%
jan 1, 2008
-4.625
-0.248
5.66%
jan 1, 2009
-3.549
+1.076
-23.27%
jan 1, 2010
-2.198
+1.351
-38.06%
jan 1, 2011
-3.003
-0.805
36.61%
jan 1, 2012
-1.72
+1.282
-42.71%
jan 1, 2013
-0.431
+1.289
-74.94%
jan 1, 2014
3.963
+4.394
-1.02K%
jan 1, 2015
4.397
+0.434
10.94%
jan 1, 2016
-3.445
-7.842
-178.36%
Ranking of countries by current statistics by years


Comments: