29
/
en
AIzaSyAYiBZKx7MnpbEhh9jyipgxe19OcubqV5w
April 1, 2024
93353
Bulgaria
BGR
true
2
1
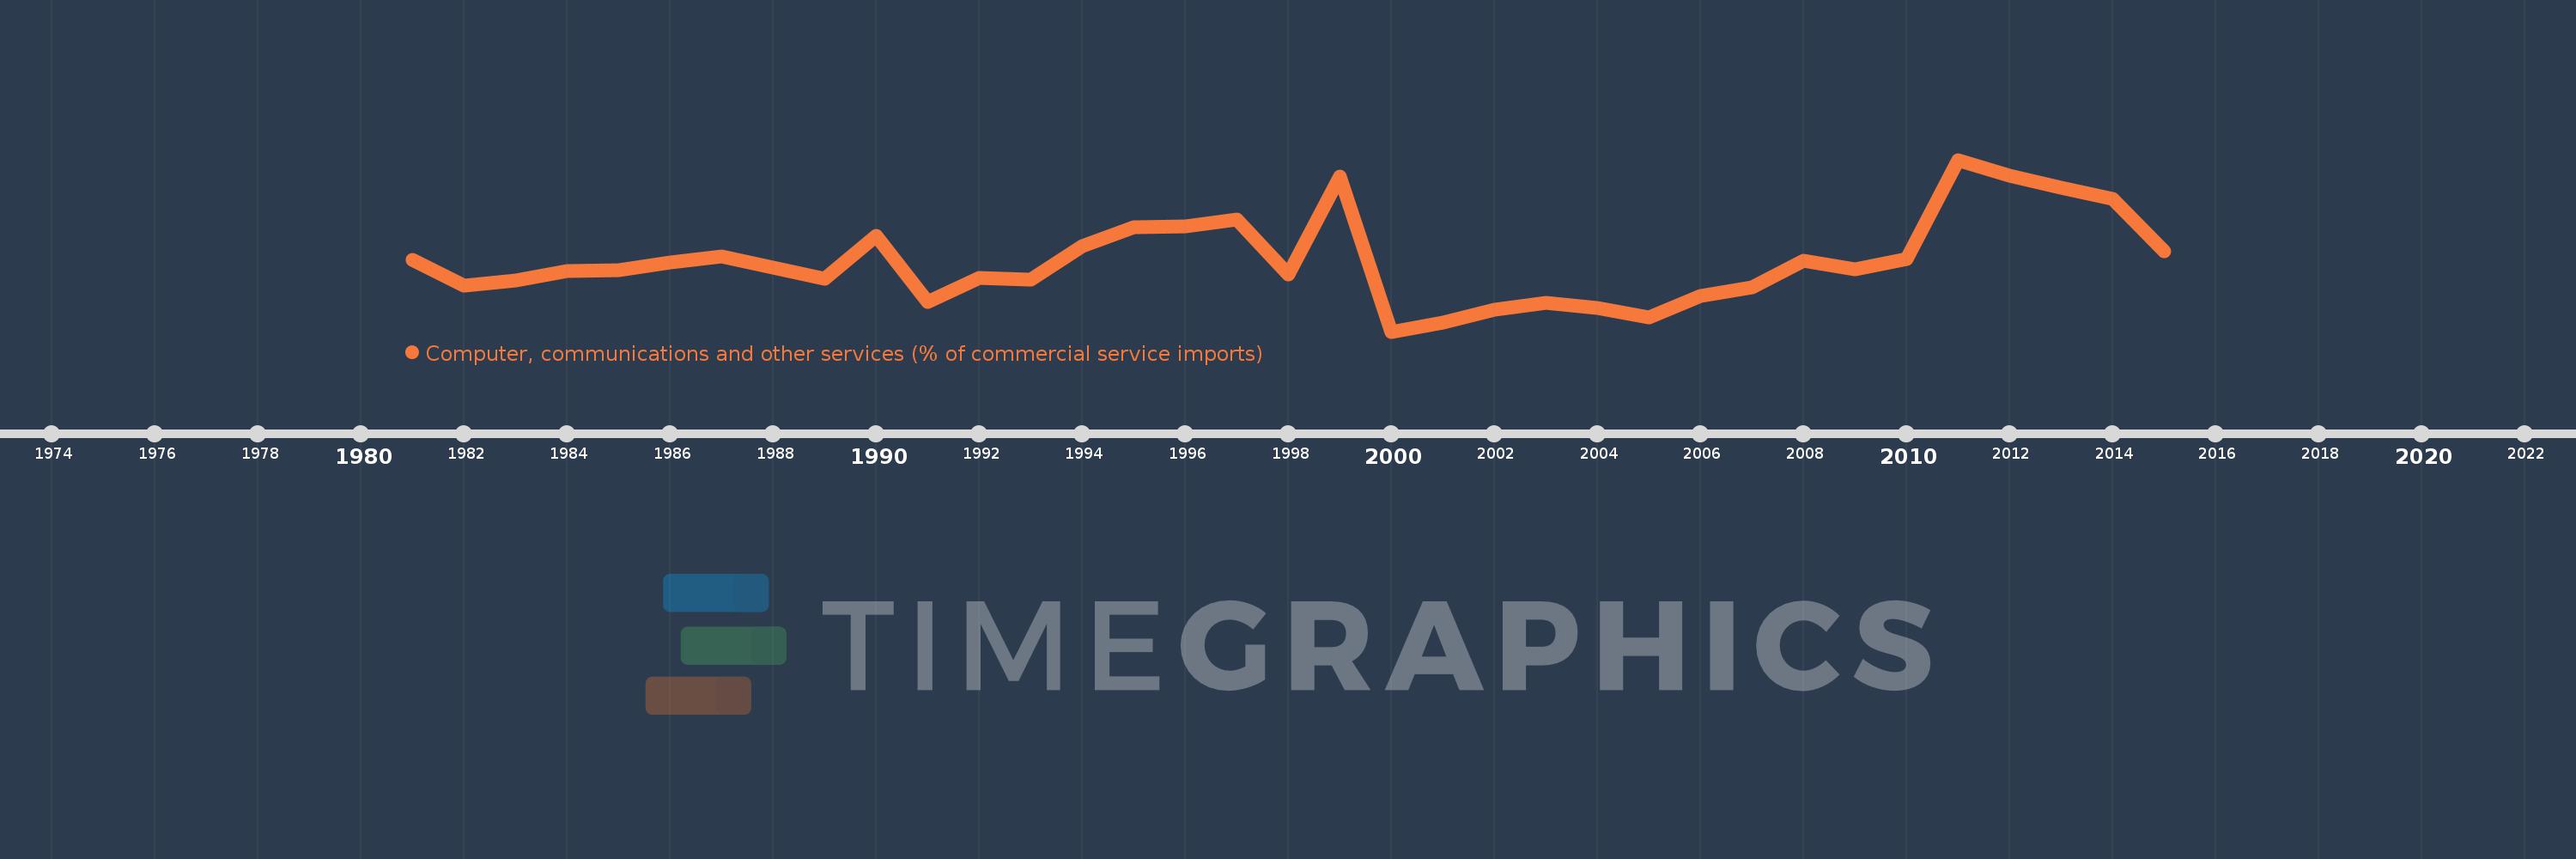
Computer, communications and other services (% of commercial service imports)
2015,2014,2013,2012,2011,2010,2009,2008,2007,2006,2005,2004,2003,2002,2001,2000,1999,1998,1997,1996,1995,1994,1993,1992,1991,1990,1989,1988,1987,1986,1985,1984,1983,1982,1981
This statistics in other country:
AfghanistanAlbaniaAlgeriaAngolaAntigua and BarbudaArab WorldArgentinaArmeniaArubaAustraliaAustriaAzerbaijanBahamas, TheBahrainBangladeshBarbadosBelarusBelgiumBelizeBeninBermudaBhutanBoliviaBosnia and HerzegovinaBotswanaBrazilBrunei DarussalamBulgariaBurkina FasoBurundiCabo VerdeCambodiaCameroonCanadaCaribbean small statesCentral African RepublicCentral Europe and the BalticsChadChileChinaColombiaComorosCongo, Dem. Rep.Congo, Rep.Costa RicaCote d'IvoireCroatiaCuracaoCyprusCzech RepublicDenmarkDjiboutiDominicaDominican RepublicEarly-demographic dividendEast Asia & PacificEast Asia & Pacific (excluding high income)East Asia & Pacific (IDA & IBRD countries)EcuadorEgypt, Arab Rep.El SalvadorEquatorial GuineaEritreaEstoniaEthiopiaEuro areaEurope & Central AsiaEurope & Central Asia (excluding high income)Europe & Central Asia (IDA & IBRD countries)European UnionFaroe IslandsFijiFinlandFragile and conflict affected situationsFranceFrench PolynesiaGabonGambia, TheGeorgiaGermanyGhanaGreeceGrenadaGuatemalaGuineaGuinea-BissauGuyanaHaitiHeavily indebted poor countries (HIPC)High incomeHondurasHong Kong SAR, ChinaHungaryIBRD onlyIcelandIDA & IBRD totalIDA onlyIDA totalIndiaIndonesiaIran, Islamic Rep.IraqIrelandIsraelItalyJamaicaJapanJordanKazakhstanKenyaKiribatiKorea, Rep.KosovoKuwaitKyrgyz RepublicLao PDRLate-demographic dividendLatin America & Caribbean Latin America & Caribbean (excluding high income)Latin America & the Caribbean (IDA & IBRD countries)LatviaLeast developed countries: UN classificationLebanonLesothoLiberiaLibyaLithuaniaLow & middle incomeLow incomeLower middle incomeLuxembourgMacao SAR, ChinaMacedonia, FYRMadagascarMalawiMalaysiaMaldivesMaliMaltaMarshall IslandsMauritaniaMauritiusMexicoMicronesia, Fed. Sts.Middle East & North AfricaMiddle East & North Africa (excluding high income)Middle East & North Africa (IDA & IBRD countries)Middle incomeMoldovaMongoliaMontenegroMoroccoMozambiqueMyanmarNamibiaNepalNetherlandsNew CaledoniaNew ZealandNicaraguaNigerNigeriaNorth AmericaNorwayOECD membersOmanOther small statesPacific island small statesPakistanPalauPanamaPapua New GuineaParaguayPeruPhilippinesPolandPortugalPost-demographic dividendPre-demographic dividendQatarRomaniaRussian FederationRwandaSamoaSao Tome and PrincipeSaudi ArabiaSenegalSerbiaSeychellesSierra LeoneSingaporeSint Maarten (Dutch part)Slovak RepublicSloveniaSmall statesSolomon IslandsSouth AfricaSouth AsiaSouth Asia (IDA & IBRD)South SudanSpainSri LankaSt. Kitts and NevisSt. LuciaSt. Vincent and the GrenadinesSub-Saharan Africa Sub-Saharan Africa (excluding high income)Sub-Saharan Africa (IDA & IBRD countries)SudanSurinameSwazilandSwedenSwitzerlandSyrian Arab RepublicTajikistanTanzaniaThailandTimor-LesteTogoTongaTrinidad and TobagoTunisiaTurkeyTuvaluUgandaUkraineUnited KingdomUnited StatesUpper middle incomeUruguayVanuatuVenezuela, RBWest Bank and GazaWorldYemen, Rep.ZambiaZimbabwe Timeline:
This timeline shows a graph from 1981 to 2015 of Bulgaria. No data until 1980. Number of actual observations by date: 35.
Source name:
World Development Indicators
Source organization:
International Monetary Fund, Balance of Payments Statistics Yearbook and data files.
Categories, topics:
Private Sector, Trade
Last updated:
apr 23, 2017
Indicators value changes by year
Minimum:
15.742
jan 1, 2000
At the date of observation
Value
Absolute change
Change from previous value
jan 1, 1981
34.426
+34.426
0.0%
jan 1, 1982
27.672
-6.754
-19.62%
jan 1, 1983
29.048
+1.376
4.97%
jan 1, 1984
31.605
+2.558
8.81%
jan 1, 1985
31.842
+0.236
0.75%
jan 1, 1986
33.792
+1.95
6.13%
jan 1, 1987
35.499
+1.707
5.05%
jan 1, 1988
32.526
-2.973
-8.37%
jan 1, 1989
29.573
-2.953
-9.08%
jan 1, 1990
40.892
+11.319
38.27%
jan 1, 1991
23.5
-17.392
-42.53%
jan 1, 1992
29.786
+6.286
26.75%
jan 1, 1993
29.351
-0.435
-1.46%
jan 1, 1994
38.022
+8.67
29.54%
jan 1, 1995
43.078
+5.057
13.3%
jan 1, 1996
43.188
+0.11
0.25%
jan 1, 1997
45.044
+1.856
4.3%
jan 1, 1998
30.604
-14.44
-32.06%
jan 1, 1999
56.399
+25.795
84.29%
jan 1, 2000
15.742
-40.657
-72.09%
jan 1, 2001
18.075
+2.333
14.82%
jan 1, 2002
21.516
+3.441
19.04%
jan 1, 2003
23.183
+1.667
7.75%
jan 1, 2004
21.959
-1.224
-5.28%
jan 1, 2005
19.553
-2.407
-10.96%
jan 1, 2006
25.055
+5.502
28.14%
jan 1, 2007
27.246
+2.191
8.75%
jan 1, 2008
34.271
+7.025
25.78%
jan 1, 2009
32.057
-2.213
-6.46%
jan 1, 2010
34.634
+2.577
8.04%
jan 1, 2011
60.69
+26.055
75.23%
jan 1, 2012
56.475
-4.215
-6.94%
jan 1, 2013
53.388
-3.087
-5.47%
jan 1, 2014
50.357
-3.031
-5.68%
jan 1, 2015
36.709
-13.647
-27.1%
Ranking of countries by current statistics by years


Comments: