29
/
en
AIzaSyAYiBZKx7MnpbEhh9jyipgxe19OcubqV5w
April 1, 2024
256155
Sweden
SWE
true
2
1
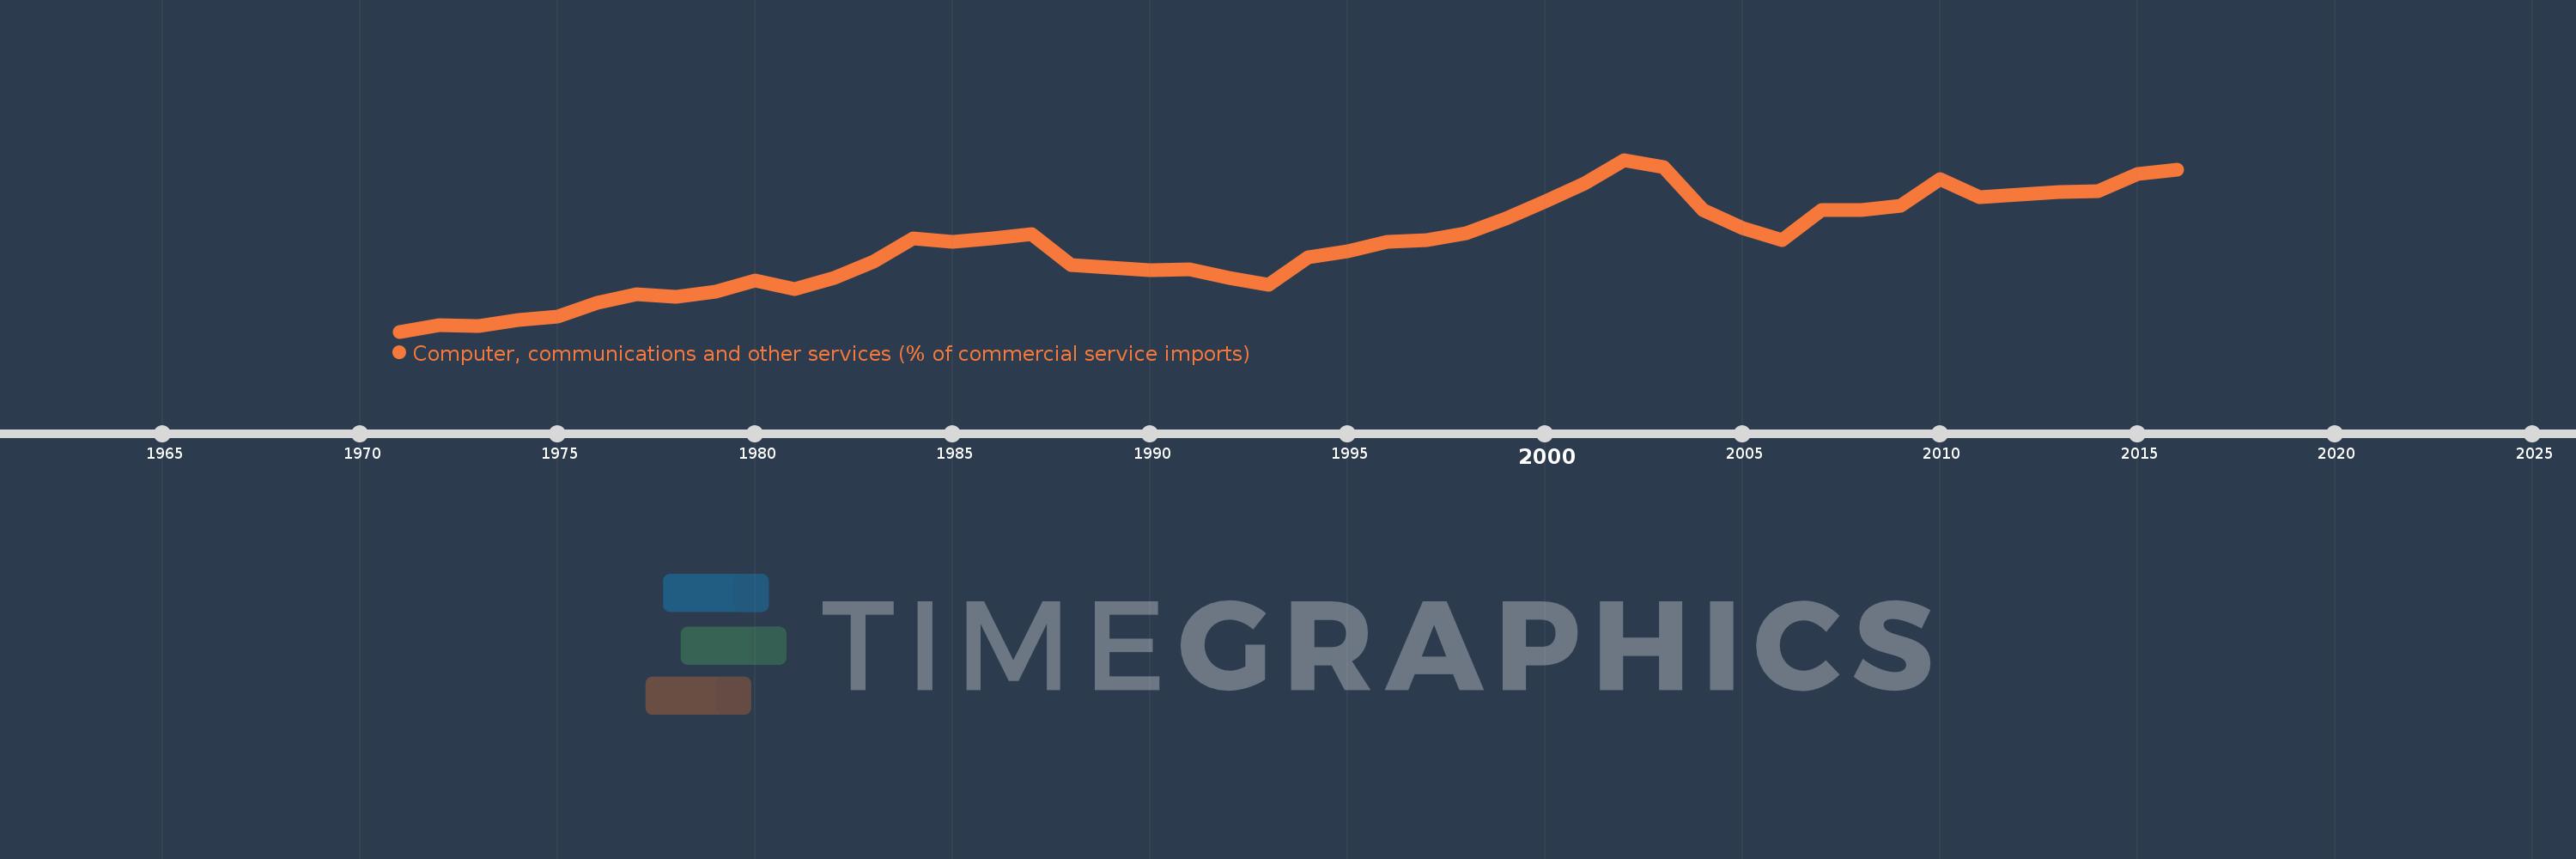
Computer, communications and other services (% of commercial service imports)
2016,2015,2014,2013,2012,2011,2010,2009,2008,2007,2006,2005,2004,2003,2002,2001,2000,1999,1998,1997,1996,1995,1994,1993,1992,1991,1990,1989,1988,1987,1986,1985,1984,1983,1982,1981,1980,1979,1978,1977,1976,1975,1974,1973,1972,1971
This statistics in other country:
AfghanistanAlbaniaAlgeriaAngolaAntigua and BarbudaArab WorldArgentinaArmeniaArubaAustraliaAustriaAzerbaijanBahamas, TheBahrainBangladeshBarbadosBelarusBelgiumBelizeBeninBermudaBhutanBoliviaBosnia and HerzegovinaBotswanaBrazilBrunei DarussalamBulgariaBurkina FasoBurundiCabo VerdeCambodiaCameroonCanadaCaribbean small statesCentral African RepublicCentral Europe and the BalticsChadChileChinaColombiaComorosCongo, Dem. Rep.Congo, Rep.Costa RicaCote d'IvoireCroatiaCuracaoCyprusCzech RepublicDenmarkDjiboutiDominicaDominican RepublicEarly-demographic dividendEast Asia & PacificEast Asia & Pacific (excluding high income)East Asia & Pacific (IDA & IBRD countries)EcuadorEgypt, Arab Rep.El SalvadorEquatorial GuineaEritreaEstoniaEthiopiaEuro areaEurope & Central AsiaEurope & Central Asia (excluding high income)Europe & Central Asia (IDA & IBRD countries)European UnionFaroe IslandsFijiFinlandFragile and conflict affected situationsFranceFrench PolynesiaGabonGambia, TheGeorgiaGermanyGhanaGreeceGrenadaGuatemalaGuineaGuinea-BissauGuyanaHaitiHeavily indebted poor countries (HIPC)High incomeHondurasHong Kong SAR, ChinaHungaryIBRD onlyIcelandIDA & IBRD totalIDA onlyIDA totalIndiaIndonesiaIran, Islamic Rep.IraqIrelandIsraelItalyJamaicaJapanJordanKazakhstanKenyaKiribatiKorea, Rep.KosovoKuwaitKyrgyz RepublicLao PDRLate-demographic dividendLatin America & Caribbean Latin America & Caribbean (excluding high income)Latin America & the Caribbean (IDA & IBRD countries)LatviaLeast developed countries: UN classificationLebanonLesothoLiberiaLibyaLithuaniaLow & middle incomeLow incomeLower middle incomeLuxembourgMacao SAR, ChinaMacedonia, FYRMadagascarMalawiMalaysiaMaldivesMaliMaltaMarshall IslandsMauritaniaMauritiusMexicoMicronesia, Fed. Sts.Middle East & North AfricaMiddle East & North Africa (excluding high income)Middle East & North Africa (IDA & IBRD countries)Middle incomeMoldovaMongoliaMontenegroMoroccoMozambiqueMyanmarNamibiaNepalNetherlandsNew CaledoniaNew ZealandNicaraguaNigerNigeriaNorth AmericaNorwayOECD membersOmanOther small statesPacific island small statesPakistanPalauPanamaPapua New GuineaParaguayPeruPhilippinesPolandPortugalPost-demographic dividendPre-demographic dividendQatarRomaniaRussian FederationRwandaSamoaSao Tome and PrincipeSaudi ArabiaSenegalSerbiaSeychellesSierra LeoneSingaporeSint Maarten (Dutch part)Slovak RepublicSloveniaSmall statesSolomon IslandsSouth AfricaSouth AsiaSouth Asia (IDA & IBRD)South SudanSpainSri LankaSt. Kitts and NevisSt. LuciaSt. Vincent and the GrenadinesSub-Saharan Africa Sub-Saharan Africa (excluding high income)Sub-Saharan Africa (IDA & IBRD countries)SudanSurinameSwazilandSwedenSwitzerlandSyrian Arab RepublicTajikistanTanzaniaThailandTimor-LesteTogoTongaTrinidad and TobagoTunisiaTurkeyTuvaluUgandaUkraineUnited KingdomUnited StatesUpper middle incomeUruguayVanuatuVenezuela, RBWest Bank and GazaWorldYemen, Rep.ZambiaZimbabwe Timeline:
This timeline shows a graph from 1971 to 2016 of Sweden. No data until 1970. Number of actual observations by date: 46.
Source name:
World Development Indicators
Source organization:
International Monetary Fund, Balance of Payments Statistics Yearbook and data files.
Categories, topics:
Private Sector, Trade
Last updated:
apr 23, 2017
Indicators value changes by year
Minimum:
18.551
jan 1, 1971
Maximum:
54.771
jan 1, 2002
At the date of observation
Value
Absolute change
Change from previous value
jan 1, 1971
18.551
+18.551
0.0%
jan 1, 1972
19.94
+1.389
7.48%
jan 1, 1973
19.759
-0.181
-0.91%
jan 1, 1974
20.934
+1.175
5.95%
jan 1, 1975
21.689
+0.755
3.61%
jan 1, 1976
24.692
+3.003
13.85%
jan 1, 1977
26.412
+1.72
6.97%
jan 1, 1978
25.823
-0.59
-2.23%
jan 1, 1979
26.912
+1.09
4.22%
jan 1, 1980
29.39
+2.477
9.21%
jan 1, 1981
27.443
-1.947
-6.62%
jan 1, 1982
29.935
+2.492
9.08%
jan 1, 1983
33.288
+3.353
11.2%
jan 1, 1984
38.266
+4.978
14.95%
jan 1, 1985
37.483
-0.783
-2.05%
jan 1, 1986
38.252
+0.77
2.05%
jan 1, 1987
39.058
+0.805
2.11%
jan 1, 1988
32.548
-6.51
-16.67%
jan 1, 1989
31.977
-0.57
-1.75%
jan 1, 1990
31.567
-0.41
-1.28%
jan 1, 1991
31.613
+0.046
0.15%
jan 1, 1992
29.835
-1.779
-5.63%
jan 1, 1993
28.404
-1.43
-4.79%
jan 1, 1994
34.135
+5.731
20.18%
jan 1, 1995
35.48
+1.345
3.94%
jan 1, 1996
37.41
+1.93
5.44%
jan 1, 1997
37.803
+0.393
1.05%
jan 1, 1998
39.322
+1.519
4.02%
jan 1, 1999
42.345
+3.022
7.69%
jan 1, 2000
45.912
+3.568
8.43%
jan 1, 2001
49.78
+3.867
8.42%
jan 1, 2002
54.771
+4.991
10.03%
jan 1, 2003
53.261
-1.51
-2.76%
jan 1, 2004
44.095
-9.165
-17.21%
jan 1, 2005
40.289
-3.807
-8.63%
jan 1, 2006
37.791
-2.497
-6.2%
jan 1, 2007
44.113
+6.321
16.73%
jan 1, 2008
44.115
+0.002
0.01%
jan 1, 2009
45.013
+0.898
2.04%
jan 1, 2010
50.733
+5.72
12.71%
jan 1, 2011
46.9
-3.833
-7.56%
jan 1, 2012
47.478
+0.578
1.23%
jan 1, 2013
47.941
+0.463
0.98%
jan 1, 2014
48.143
+0.202
0.42%
jan 1, 2015
51.83
+3.687
7.66%
jan 1, 2016
52.603
+0.773
1.49%
Ranking of countries by current statistics by years


Comments: