29
/
en
AIzaSyAYiBZKx7MnpbEhh9jyipgxe19OcubqV5w
April 1, 2024
154374
India
IND
true
2
1
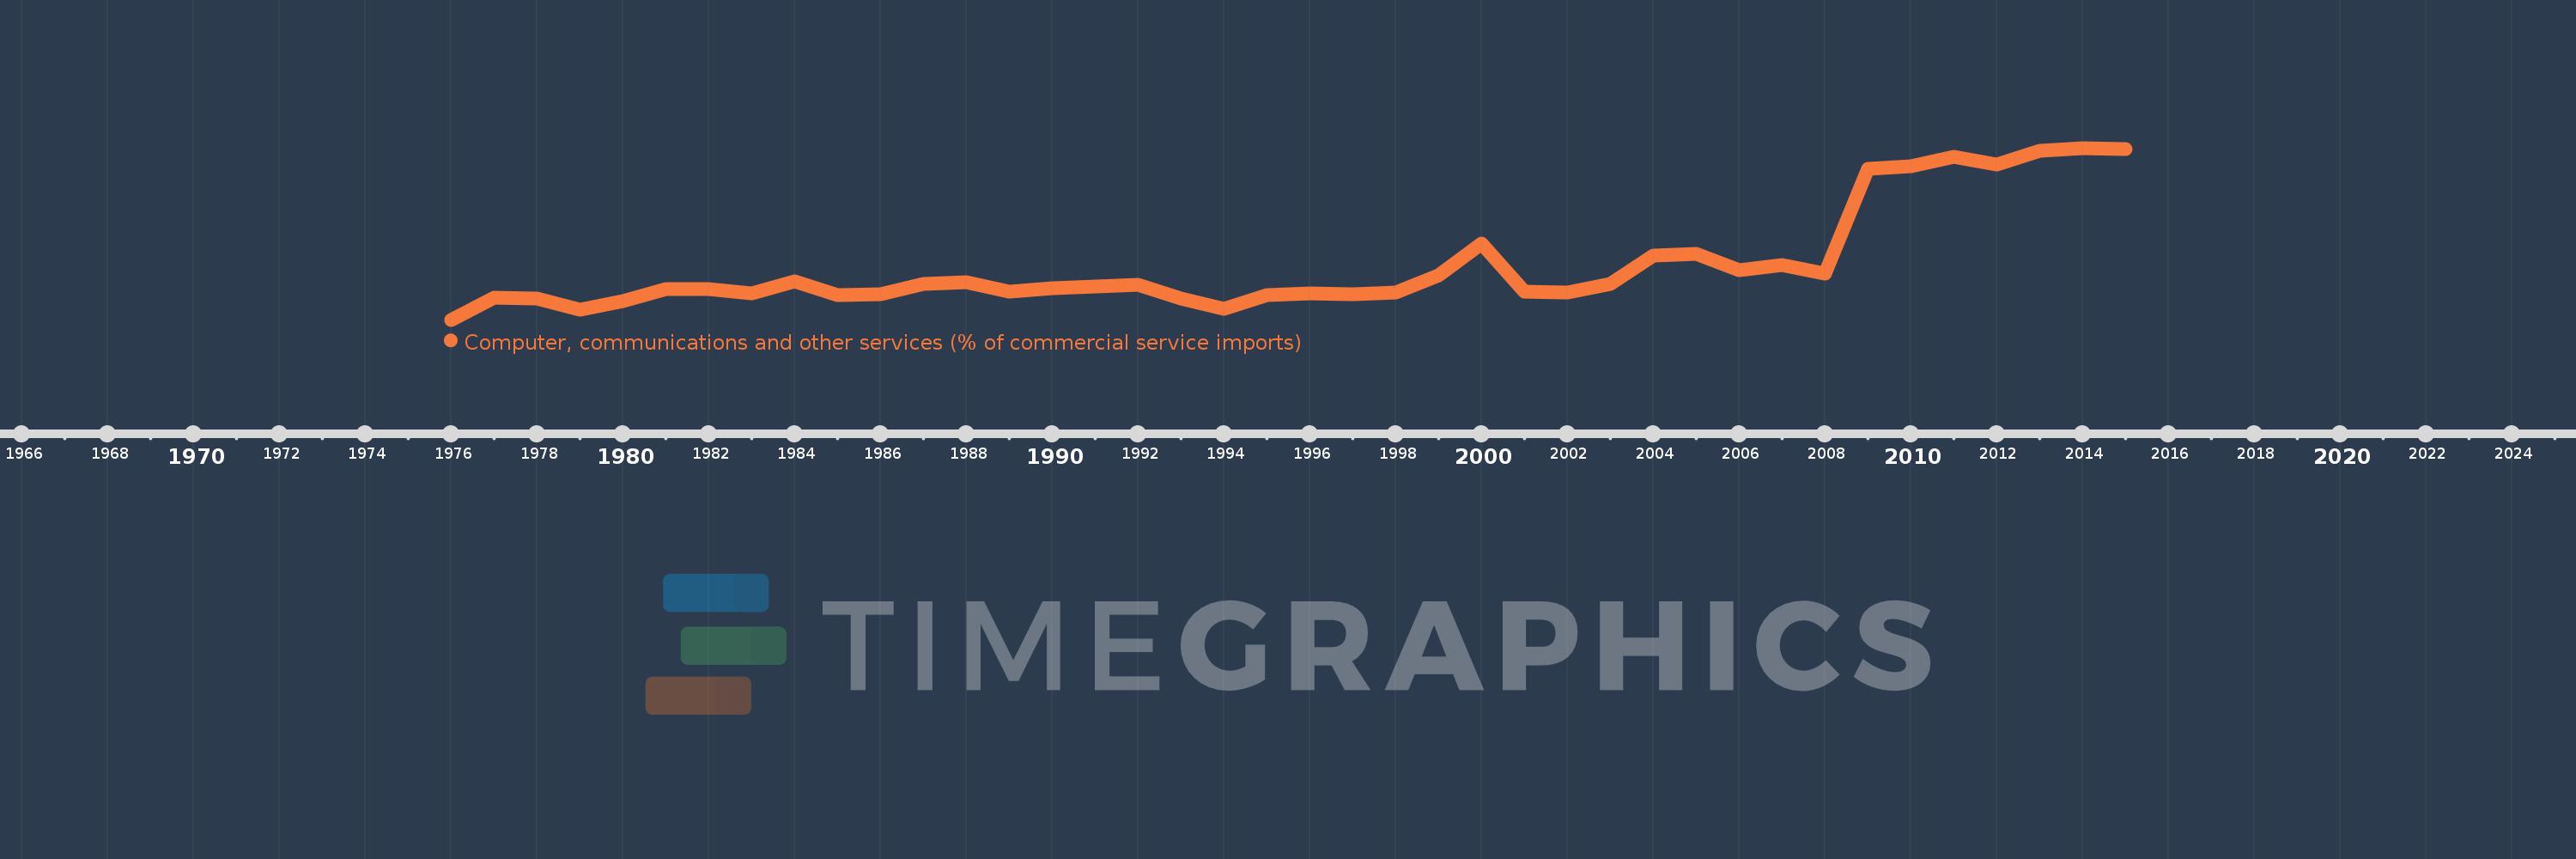
Computer, communications and other services (% of commercial service imports)
2015,2014,2013,2012,2011,2010,2009,2008,2007,2006,2005,2004,2003,2002,2001,2000,1999,1998,1997,1996,1995,1994,1993,1992,1991,1990,1989,1988,1987,1986,1985,1984,1983,1982,1981,1980,1979,1978,1977,1976
This statistics in other country:
AfghanistanAlbaniaAlgeriaAngolaAntigua and BarbudaArab WorldArgentinaArmeniaArubaAustraliaAustriaAzerbaijanBahamas, TheBahrainBangladeshBarbadosBelarusBelgiumBelizeBeninBermudaBhutanBoliviaBosnia and HerzegovinaBotswanaBrazilBrunei DarussalamBulgariaBurkina FasoBurundiCabo VerdeCambodiaCameroonCanadaCaribbean small statesCentral African RepublicCentral Europe and the BalticsChadChileChinaColombiaComorosCongo, Dem. Rep.Congo, Rep.Costa RicaCote d'IvoireCroatiaCuracaoCyprusCzech RepublicDenmarkDjiboutiDominicaDominican RepublicEarly-demographic dividendEast Asia & PacificEast Asia & Pacific (excluding high income)East Asia & Pacific (IDA & IBRD countries)EcuadorEgypt, Arab Rep.El SalvadorEquatorial GuineaEritreaEstoniaEthiopiaEuro areaEurope & Central AsiaEurope & Central Asia (excluding high income)Europe & Central Asia (IDA & IBRD countries)European UnionFaroe IslandsFijiFinlandFragile and conflict affected situationsFranceFrench PolynesiaGabonGambia, TheGeorgiaGermanyGhanaGreeceGrenadaGuatemalaGuineaGuinea-BissauGuyanaHaitiHeavily indebted poor countries (HIPC)High incomeHondurasHong Kong SAR, ChinaHungaryIBRD onlyIcelandIDA & IBRD totalIDA onlyIDA totalIndiaIndonesiaIran, Islamic Rep.IraqIrelandIsraelItalyJamaicaJapanJordanKazakhstanKenyaKiribatiKorea, Rep.KosovoKuwaitKyrgyz RepublicLao PDRLate-demographic dividendLatin America & Caribbean Latin America & Caribbean (excluding high income)Latin America & the Caribbean (IDA & IBRD countries)LatviaLeast developed countries: UN classificationLebanonLesothoLiberiaLibyaLithuaniaLow & middle incomeLow incomeLower middle incomeLuxembourgMacao SAR, ChinaMacedonia, FYRMadagascarMalawiMalaysiaMaldivesMaliMaltaMarshall IslandsMauritaniaMauritiusMexicoMicronesia, Fed. Sts.Middle East & North AfricaMiddle East & North Africa (excluding high income)Middle East & North Africa (IDA & IBRD countries)Middle incomeMoldovaMongoliaMontenegroMoroccoMozambiqueMyanmarNamibiaNepalNetherlandsNew CaledoniaNew ZealandNicaraguaNigerNigeriaNorth AmericaNorwayOECD membersOmanOther small statesPacific island small statesPakistanPalauPanamaPapua New GuineaParaguayPeruPhilippinesPolandPortugalPost-demographic dividendPre-demographic dividendQatarRomaniaRussian FederationRwandaSamoaSao Tome and PrincipeSaudi ArabiaSenegalSerbiaSeychellesSierra LeoneSingaporeSint Maarten (Dutch part)Slovak RepublicSloveniaSmall statesSolomon IslandsSouth AfricaSouth AsiaSouth Asia (IDA & IBRD)South SudanSpainSri LankaSt. Kitts and NevisSt. LuciaSt. Vincent and the GrenadinesSub-Saharan Africa Sub-Saharan Africa (excluding high income)Sub-Saharan Africa (IDA & IBRD countries)SudanSurinameSwazilandSwedenSwitzerlandSyrian Arab RepublicTajikistanTanzaniaThailandTimor-LesteTogoTongaTrinidad and TobagoTunisiaTurkeyTuvaluUgandaUkraineUnited KingdomUnited StatesUpper middle incomeUruguayVanuatuVenezuela, RBWest Bank and GazaWorldYemen, Rep.ZambiaZimbabwe Timeline:
This timeline shows a graph from 1976 to 2015 of India. No data until 1975. Number of actual observations by date: 40.
Source name:
World Development Indicators
Source organization:
International Monetary Fund, Balance of Payments Statistics Yearbook and data files.
Categories, topics:
Private Sector, Trade
Last updated:
apr 23, 2017
Indicators value changes by year
Minimum:
19.559
jan 1, 1976
Maximum:
73.911
jan 1, 2014
At the date of observation
Value
Absolute change
Change from previous value
jan 1, 1976
19.559
+19.559
0.0%
jan 1, 1977
26.588
+7.029
35.94%
jan 1, 1978
26.271
-0.317
-1.19%
jan 1, 1979
22.729
-3.542
-13.48%
jan 1, 1980
25.353
+2.624
11.55%
jan 1, 1981
29.391
+4.038
15.93%
jan 1, 1982
29.286
-0.106
-0.36%
jan 1, 1983
27.803
-1.483
-5.06%
jan 1, 1984
31.632
+3.829
13.77%
jan 1, 1985
27.258
-4.375
-13.83%
jan 1, 1986
27.565
+0.307
1.13%
jan 1, 1987
30.862
+3.297
11.96%
jan 1, 1988
31.427
+0.566
1.83%
jan 1, 1989
28.541
-2.886
-9.18%
jan 1, 1990
29.47
+0.929
3.25%
jan 1, 1991
30.078
+0.608
2.06%
jan 1, 1992
30.555
+0.477
1.59%
jan 1, 1993
26.25
-4.305
-14.09%
jan 1, 1994
23.074
-3.177
-12.1%
jan 1, 1995
27.473
+4.4
19.07%
jan 1, 1996
27.868
+0.395
1.44%
jan 1, 1997
27.754
-0.114
-0.41%
jan 1, 1998
28.279
+0.525
1.89%
jan 1, 1999
33.522
+5.243
18.54%
jan 1, 2000
43.659
+10.136
30.24%
jan 1, 2001
28.371
-15.288
-35.02%
jan 1, 2002
28.117
-0.254
-0.89%
jan 1, 2003
30.983
+2.866
10.19%
jan 1, 2004
39.809
+8.827
28.49%
jan 1, 2005
40.51
+0.701
1.76%
jan 1, 2006
35.176
-5.334
-13.17%
jan 1, 2007
36.897
+1.721
4.89%
jan 1, 2008
34.183
-2.714
-7.36%
jan 1, 2009
67.337
+33.154
96.99%
jan 1, 2010
68.043
+0.707
1.05%
jan 1, 2011
71.069
+3.026
4.45%
jan 1, 2012
68.733
-2.336
-3.29%
jan 1, 2013
72.99
+4.257
6.19%
jan 1, 2014
73.911
+0.921
1.26%
jan 1, 2015
73.472
-0.439
-0.59%
Ranking of countries by current statistics by years


Comments: