29
/
en
AIzaSyAYiBZKx7MnpbEhh9jyipgxe19OcubqV5w
April 1, 2024
160314
Israel
ISR
true
2
1
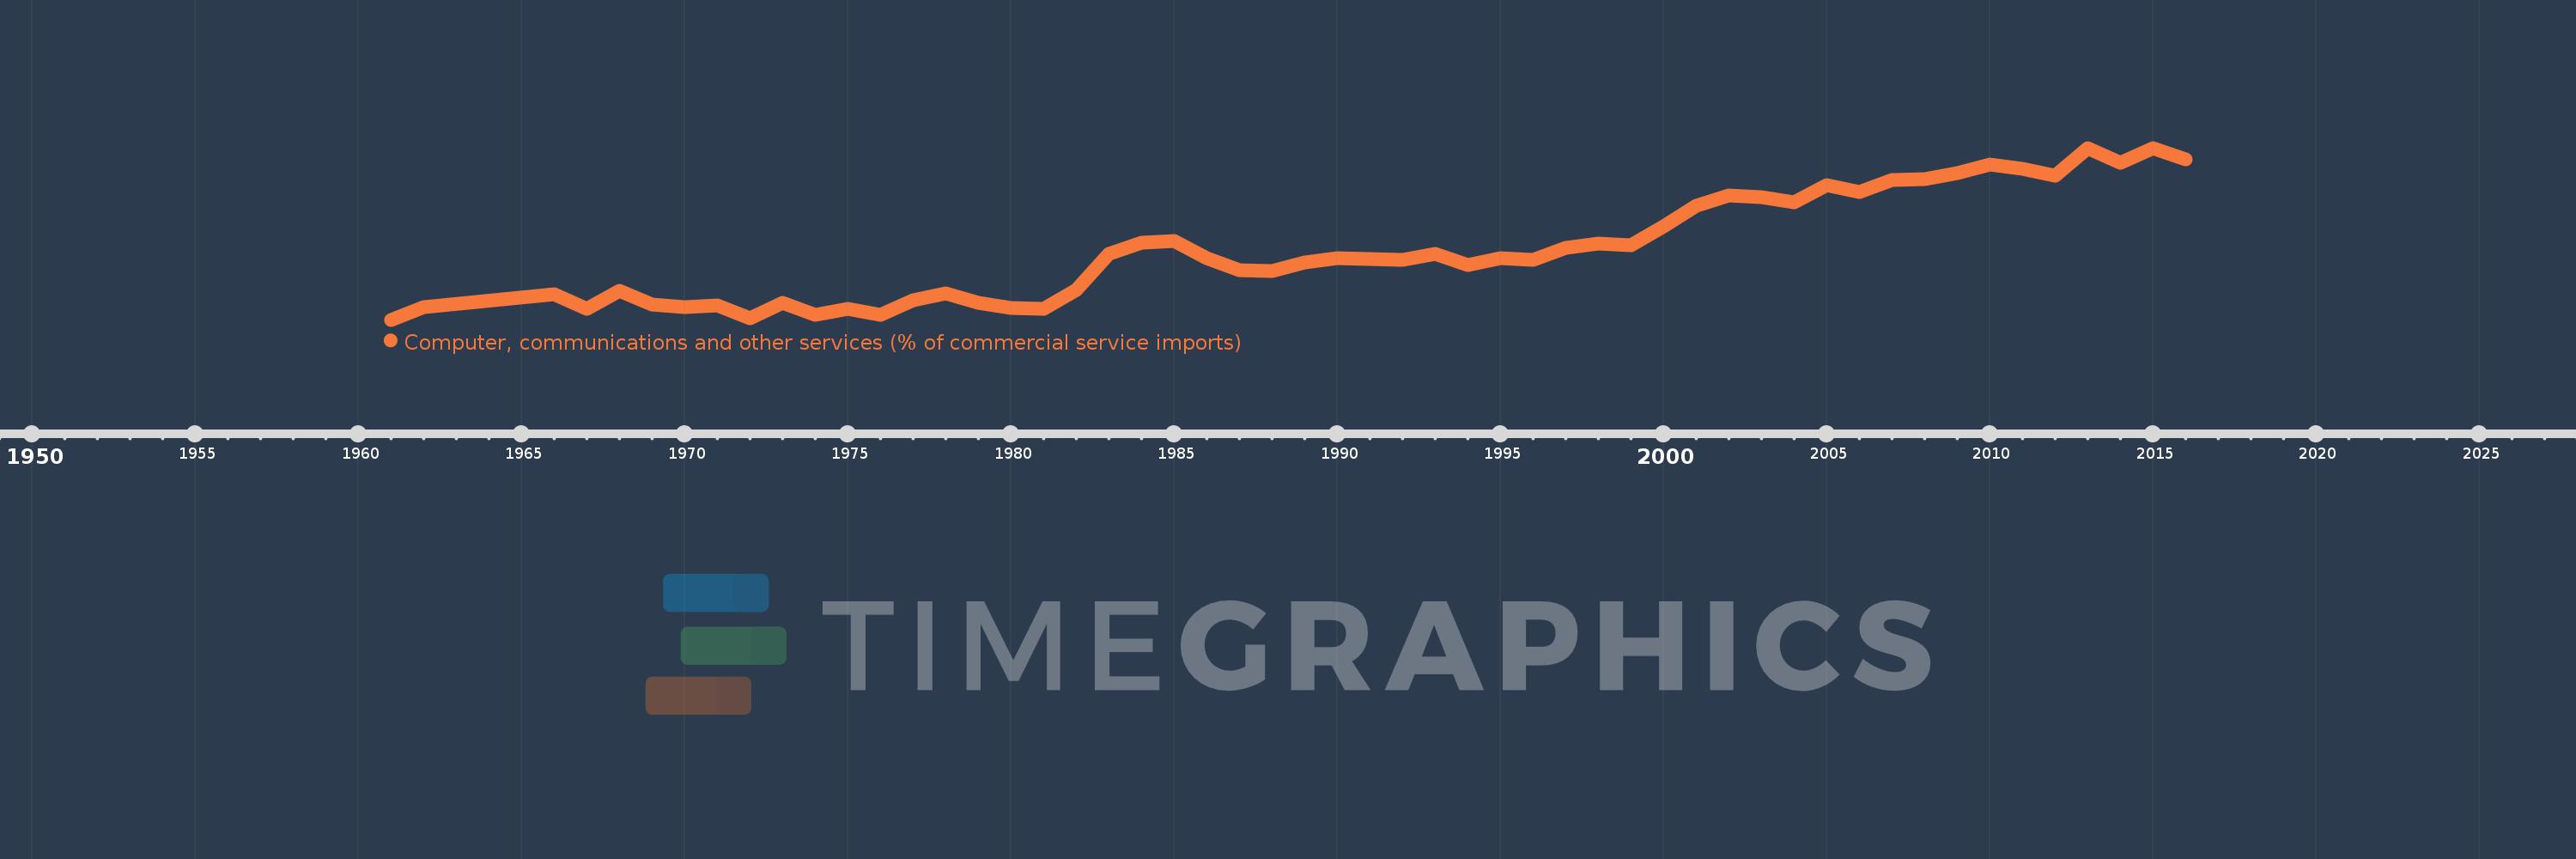
Computer, communications and other services (% of commercial service imports)
2016,2015,2014,2013,2012,2011,2010,2009,2008,2007,2006,2005,2004,2003,2002,2001,2000,1999,1998,1997,1996,1995,1994,1993,1992,1991,1990,1989,1988,1987,1986,1985,1984,1983,1982,1981,1980,1979,1978,1977,1976,1975,1974,1973,1972,1971,1970,1969,1968,1967,1966,1962,1961
This statistics in other country:
AfghanistanAlbaniaAlgeriaAngolaAntigua and BarbudaArab WorldArgentinaArmeniaArubaAustraliaAustriaAzerbaijanBahamas, TheBahrainBangladeshBarbadosBelarusBelgiumBelizeBeninBermudaBhutanBoliviaBosnia and HerzegovinaBotswanaBrazilBrunei DarussalamBulgariaBurkina FasoBurundiCabo VerdeCambodiaCameroonCanadaCaribbean small statesCentral African RepublicCentral Europe and the BalticsChadChileChinaColombiaComorosCongo, Dem. Rep.Congo, Rep.Costa RicaCote d'IvoireCroatiaCuracaoCyprusCzech RepublicDenmarkDjiboutiDominicaDominican RepublicEarly-demographic dividendEast Asia & PacificEast Asia & Pacific (excluding high income)East Asia & Pacific (IDA & IBRD countries)EcuadorEgypt, Arab Rep.El SalvadorEquatorial GuineaEritreaEstoniaEthiopiaEuro areaEurope & Central AsiaEurope & Central Asia (excluding high income)Europe & Central Asia (IDA & IBRD countries)European UnionFaroe IslandsFijiFinlandFragile and conflict affected situationsFranceFrench PolynesiaGabonGambia, TheGeorgiaGermanyGhanaGreeceGrenadaGuatemalaGuineaGuinea-BissauGuyanaHaitiHeavily indebted poor countries (HIPC)High incomeHondurasHong Kong SAR, ChinaHungaryIBRD onlyIcelandIDA & IBRD totalIDA onlyIDA totalIndiaIndonesiaIran, Islamic Rep.IraqIrelandIsraelItalyJamaicaJapanJordanKazakhstanKenyaKiribatiKorea, Rep.KosovoKuwaitKyrgyz RepublicLao PDRLate-demographic dividendLatin America & Caribbean Latin America & Caribbean (excluding high income)Latin America & the Caribbean (IDA & IBRD countries)LatviaLeast developed countries: UN classificationLebanonLesothoLiberiaLibyaLithuaniaLow & middle incomeLow incomeLower middle incomeLuxembourgMacao SAR, ChinaMacedonia, FYRMadagascarMalawiMalaysiaMaldivesMaliMaltaMarshall IslandsMauritaniaMauritiusMexicoMicronesia, Fed. Sts.Middle East & North AfricaMiddle East & North Africa (excluding high income)Middle East & North Africa (IDA & IBRD countries)Middle incomeMoldovaMongoliaMontenegroMoroccoMozambiqueMyanmarNamibiaNepalNetherlandsNew CaledoniaNew ZealandNicaraguaNigerNigeriaNorth AmericaNorwayOECD membersOmanOther small statesPacific island small statesPakistanPalauPanamaPapua New GuineaParaguayPeruPhilippinesPolandPortugalPost-demographic dividendPre-demographic dividendQatarRomaniaRussian FederationRwandaSamoaSao Tome and PrincipeSaudi ArabiaSenegalSerbiaSeychellesSierra LeoneSingaporeSint Maarten (Dutch part)Slovak RepublicSloveniaSmall statesSolomon IslandsSouth AfricaSouth AsiaSouth Asia (IDA & IBRD)South SudanSpainSri LankaSt. Kitts and NevisSt. LuciaSt. Vincent and the GrenadinesSub-Saharan Africa Sub-Saharan Africa (excluding high income)Sub-Saharan Africa (IDA & IBRD countries)SudanSurinameSwazilandSwedenSwitzerlandSyrian Arab RepublicTajikistanTanzaniaThailandTimor-LesteTogoTongaTrinidad and TobagoTunisiaTurkeyTuvaluUgandaUkraineUnited KingdomUnited StatesUpper middle incomeUruguayVanuatuVenezuela, RBWest Bank and GazaWorldYemen, Rep.ZambiaZimbabwe Timeline:
This timeline shows a graph from 1961 to 2016 of Israel. No data until 1960. Number of actual observations by date: 53.
Source name:
World Development Indicators
Source organization:
International Monetary Fund, Balance of Payments Statistics Yearbook and data files.
Categories, topics:
Private Sector, Trade
Last updated:
apr 23, 2017
Indicators value changes by year
Minimum:
12.871
jan 1, 1961
Maximum:
50.818
jan 1, 2015
At the date of observation
Value
Absolute change
Change from previous value
jan 1, 1961
12.871
+12.871
0.0%
jan 1, 1962
15.748
+2.877
22.35%
jan 1, 1966
18.548
+2.8
17.78%
jan 1, 1967
15.267
-3.281
-17.69%
jan 1, 1968
19.333
+4.066
26.63%
jan 1, 1969
16.216
-3.117
-16.12%
jan 1, 1970
15.625
-0.591
-3.65%
jan 1, 1971
16.04
+0.415
2.66%
jan 1, 1972
13.112
-2.928
-18.26%
jan 1, 1973
16.58
+3.468
26.45%
jan 1, 1974
14.013
-2.568
-15.49%
jan 1, 1975
15.253
+1.24
8.85%
jan 1, 1976
13.96
-1.293
-8.48%
jan 1, 1977
17.111
+3.151
22.57%
jan 1, 1978
18.61
+1.499
8.76%
jan 1, 1979
16.619
-1.991
-10.7%
jan 1, 1980
15.565
-1.053
-6.34%
jan 1, 1981
15.263
-0.302
-1.94%
jan 1, 1982
19.469
+4.205
27.55%
jan 1, 1983
27.477
+8.008
41.13%
jan 1, 1984
29.893
+2.416
8.79%
jan 1, 1985
30.239
+0.346
1.16%
jan 1, 1986
26.399
-3.84
-12.7%
jan 1, 1987
23.893
-2.506
-9.49%
jan 1, 1988
23.631
-0.262
-1.1%
jan 1, 1989
25.583
+1.953
8.26%
jan 1, 1990
26.397
+0.814
3.18%
jan 1, 1991
26.249
-0.149
-0.56%
jan 1, 1992
26.119
-0.13
-0.49%
jan 1, 1993
27.421
+1.302
4.98%
jan 1, 1994
24.886
-2.534
-9.24%
jan 1, 1995
26.458
+1.572
6.32%
jan 1, 1996
26.048
-0.41
-1.55%
jan 1, 1997
28.827
+2.779
10.67%
jan 1, 1998
29.697
+0.87
3.02%
jan 1, 1999
29.361
-0.335
-1.13%
jan 1, 2000
33.483
+4.122
14.04%
jan 1, 2001
37.969
+4.485
13.4%
jan 1, 2002
40.247
+2.279
6.0%
jan 1, 2003
40.008
-0.239
-0.59%
jan 1, 2004
38.832
-1.176
-2.94%
jan 1, 2005
42.536
+3.704
9.54%
jan 1, 2006
41.081
-1.455
-3.42%
jan 1, 2007
43.681
+2.6
6.33%
jan 1, 2008
43.961
+0.28
0.64%
jan 1, 2009
45.24
+1.279
2.91%
jan 1, 2010
47.176
+1.935
4.28%
jan 1, 2011
46.157
-1.019
-2.16%
jan 1, 2012
44.702
-1.454
-3.15%
jan 1, 2013
50.76
+6.058
13.55%
jan 1, 2014
47.482
-3.278
-6.46%
jan 1, 2015
50.818
+3.336
7.03%
jan 1, 2016
48.338
-2.48
-4.88%
Ranking of countries by current statistics by years


Comments: