29
/
en
AIzaSyAYiBZKx7MnpbEhh9jyipgxe19OcubqV5w
April 1, 2024
104684
Chile
CHL
true
2
1
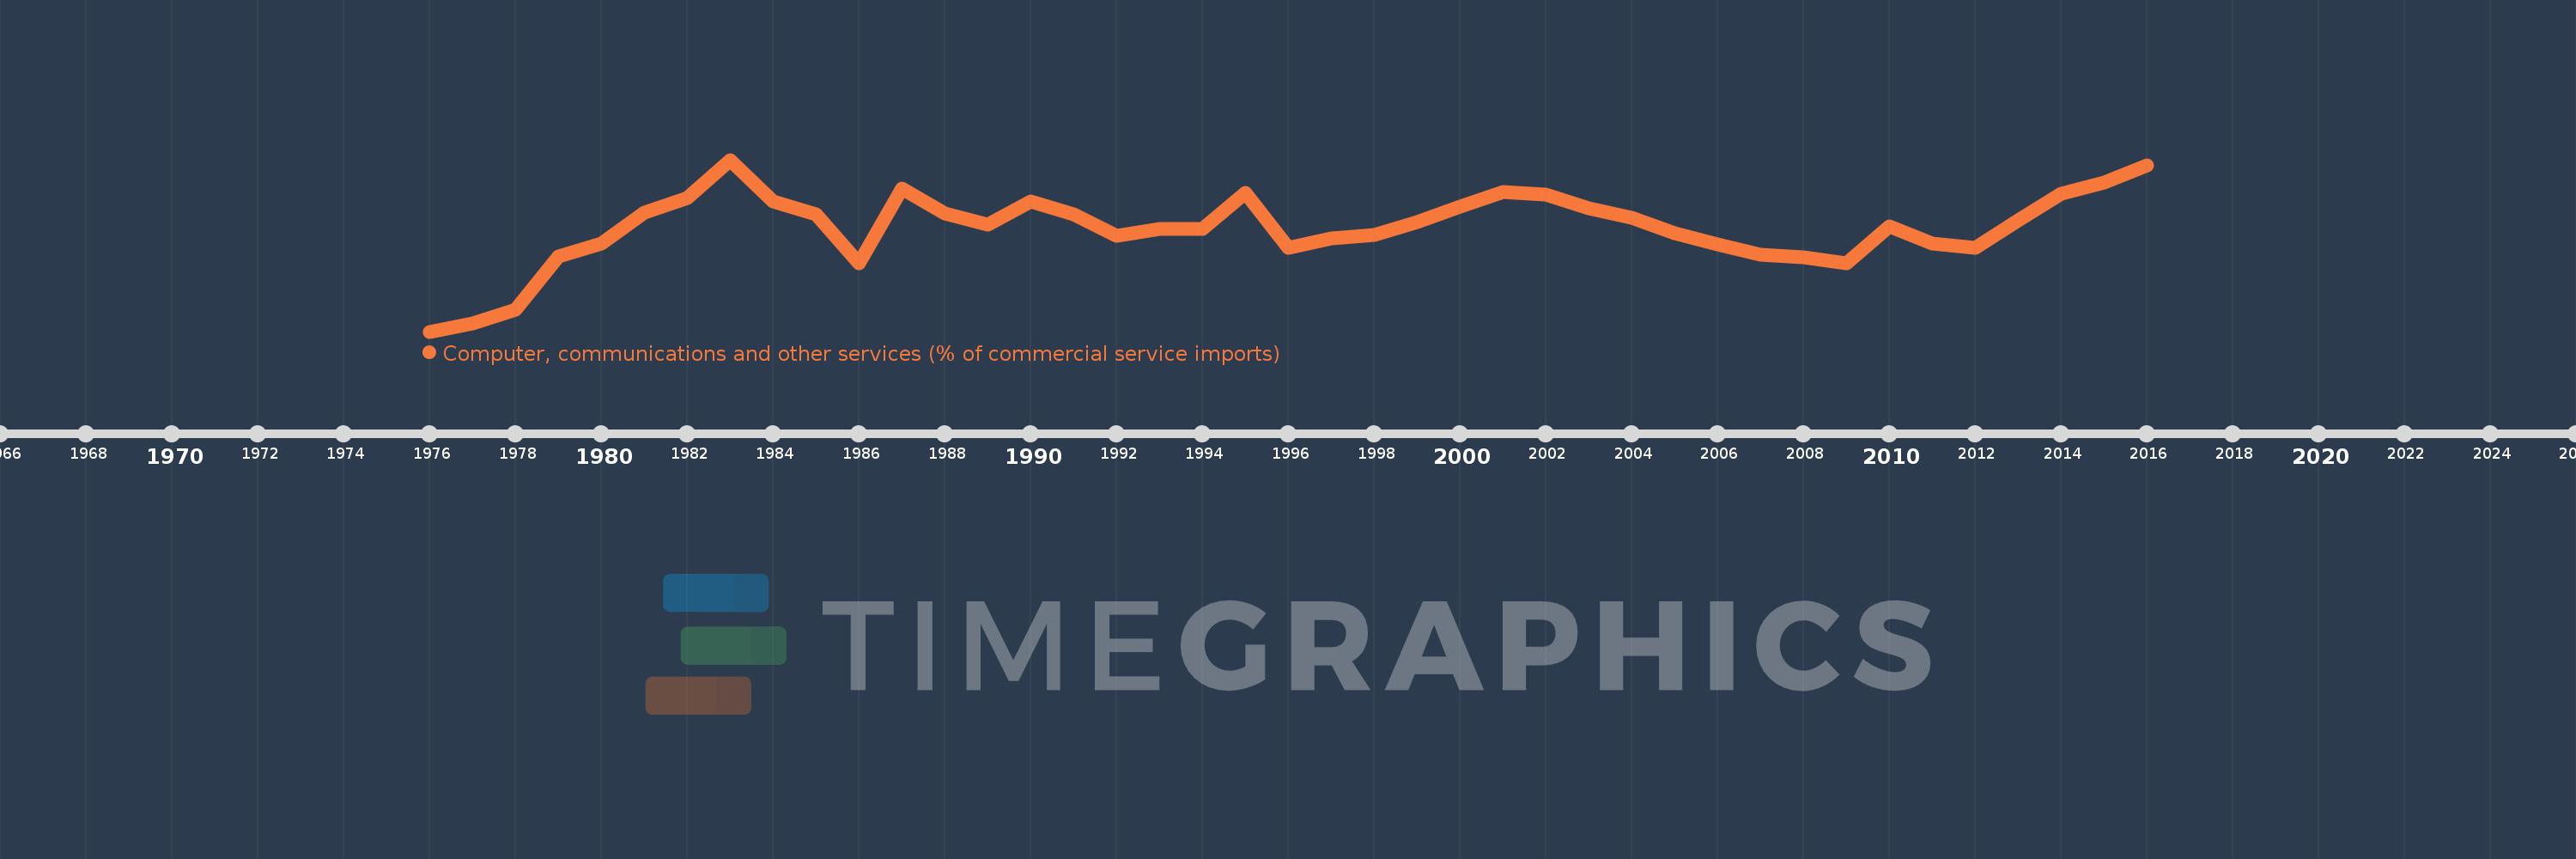
Computer, communications and other services (% of commercial service imports)
2016,2015,2014,2013,2012,2011,2010,2009,2008,2007,2006,2005,2004,2003,2002,2001,2000,1999,1998,1997,1996,1995,1994,1993,1992,1991,1990,1989,1988,1987,1986,1985,1984,1983,1982,1981,1980,1979,1978,1977,1976
This statistics in other country:
AfghanistanAlbaniaAlgeriaAngolaAntigua and BarbudaArab WorldArgentinaArmeniaArubaAustraliaAustriaAzerbaijanBahamas, TheBahrainBangladeshBarbadosBelarusBelgiumBelizeBeninBermudaBhutanBoliviaBosnia and HerzegovinaBotswanaBrazilBrunei DarussalamBulgariaBurkina FasoBurundiCabo VerdeCambodiaCameroonCanadaCaribbean small statesCentral African RepublicCentral Europe and the BalticsChadChileChinaColombiaComorosCongo, Dem. Rep.Congo, Rep.Costa RicaCote d'IvoireCroatiaCuracaoCyprusCzech RepublicDenmarkDjiboutiDominicaDominican RepublicEarly-demographic dividendEast Asia & PacificEast Asia & Pacific (excluding high income)East Asia & Pacific (IDA & IBRD countries)EcuadorEgypt, Arab Rep.El SalvadorEquatorial GuineaEritreaEstoniaEthiopiaEuro areaEurope & Central AsiaEurope & Central Asia (excluding high income)Europe & Central Asia (IDA & IBRD countries)European UnionFaroe IslandsFijiFinlandFragile and conflict affected situationsFranceFrench PolynesiaGabonGambia, TheGeorgiaGermanyGhanaGreeceGrenadaGuatemalaGuineaGuinea-BissauGuyanaHaitiHeavily indebted poor countries (HIPC)High incomeHondurasHong Kong SAR, ChinaHungaryIBRD onlyIcelandIDA & IBRD totalIDA onlyIDA totalIndiaIndonesiaIran, Islamic Rep.IraqIrelandIsraelItalyJamaicaJapanJordanKazakhstanKenyaKiribatiKorea, Rep.KosovoKuwaitKyrgyz RepublicLao PDRLate-demographic dividendLatin America & Caribbean Latin America & Caribbean (excluding high income)Latin America & the Caribbean (IDA & IBRD countries)LatviaLeast developed countries: UN classificationLebanonLesothoLiberiaLibyaLithuaniaLow & middle incomeLow incomeLower middle incomeLuxembourgMacao SAR, ChinaMacedonia, FYRMadagascarMalawiMalaysiaMaldivesMaliMaltaMarshall IslandsMauritaniaMauritiusMexicoMicronesia, Fed. Sts.Middle East & North AfricaMiddle East & North Africa (excluding high income)Middle East & North Africa (IDA & IBRD countries)Middle incomeMoldovaMongoliaMontenegroMoroccoMozambiqueMyanmarNamibiaNepalNetherlandsNew CaledoniaNew ZealandNicaraguaNigerNigeriaNorth AmericaNorwayOECD membersOmanOther small statesPacific island small statesPakistanPalauPanamaPapua New GuineaParaguayPeruPhilippinesPolandPortugalPost-demographic dividendPre-demographic dividendQatarRomaniaRussian FederationRwandaSamoaSao Tome and PrincipeSaudi ArabiaSenegalSerbiaSeychellesSierra LeoneSingaporeSint Maarten (Dutch part)Slovak RepublicSloveniaSmall statesSolomon IslandsSouth AfricaSouth AsiaSouth Asia (IDA & IBRD)South SudanSpainSri LankaSt. Kitts and NevisSt. LuciaSt. Vincent and the GrenadinesSub-Saharan Africa Sub-Saharan Africa (excluding high income)Sub-Saharan Africa (IDA & IBRD countries)SudanSurinameSwazilandSwedenSwitzerlandSyrian Arab RepublicTajikistanTanzaniaThailandTimor-LesteTogoTongaTrinidad and TobagoTunisiaTurkeyTuvaluUgandaUkraineUnited KingdomUnited StatesUpper middle incomeUruguayVanuatuVenezuela, RBWest Bank and GazaWorldYemen, Rep.ZambiaZimbabwe Timeline:
This timeline shows a graph from 1976 to 2016 of Chile. No data until 1975. Number of actual observations by date: 41.
Source name:
World Development Indicators
Source organization:
International Monetary Fund, Balance of Payments Statistics Yearbook and data files.
Categories, topics:
Private Sector, Trade
Last updated:
apr 23, 2017
Indicators value changes by year
Maximum:
37.385
jan 1, 1983
At the date of observation
Value
Absolute change
Change from previous value
jan 1, 1976
7.373
+7.373
0.0%
jan 1, 1977
8.81
+1.436
19.48%
jan 1, 1978
11.27
+2.46
27.93%
jan 1, 1979
20.491
+9.221
81.82%
jan 1, 1980
22.784
+2.293
11.19%
jan 1, 1981
28.15
+5.367
23.55%
jan 1, 1982
30.728
+2.578
9.16%
jan 1, 1983
37.385
+6.657
21.67%
jan 1, 1984
30.108
-7.278
-19.47%
jan 1, 1985
27.828
-2.28
-7.57%
jan 1, 1986
19.268
-8.56
-30.76%
jan 1, 1987
32.331
+13.063
67.8%
jan 1, 1988
27.934
-4.397
-13.6%
jan 1, 1989
25.995
-1.939
-6.94%
jan 1, 1990
30.136
+4.141
15.93%
jan 1, 1991
27.883
-2.253
-7.48%
jan 1, 1992
24.128
-3.755
-13.47%
jan 1, 1993
25.323
+1.195
4.95%
jan 1, 1994
25.372
+0.049
0.19%
jan 1, 1995
31.663
+6.291
24.79%
jan 1, 1996
21.935
-9.728
-30.72%
jan 1, 1997
23.667
+1.732
7.9%
jan 1, 1998
24.271
+0.604
2.55%
jan 1, 1999
26.492
+2.22
9.15%
jan 1, 2000
29.173
+2.681
10.12%
jan 1, 2001
31.769
+2.597
8.9%
jan 1, 2002
31.261
-0.508
-1.6%
jan 1, 2003
28.946
-2.315
-7.41%
jan 1, 2004
27.203
-1.743
-6.02%
jan 1, 2005
24.614
-2.589
-9.52%
jan 1, 2006
22.661
-1.953
-7.94%
jan 1, 2007
20.833
-1.828
-8.07%
jan 1, 2008
20.303
-0.53
-2.55%
jan 1, 2009
19.333
-0.969
-4.77%
jan 1, 2010
25.826
+6.492
33.58%
jan 1, 2011
22.701
-3.125
-12.1%
jan 1, 2012
21.994
-0.707
-3.12%
jan 1, 2013
26.865
+4.872
22.15%
jan 1, 2014
31.459
+4.594
17.1%
jan 1, 2015
33.439
+1.979
6.29%
jan 1, 2016
36.408
+2.969
8.88%
Ranking of countries by current statistics by years


Comments: