29
/
en
AIzaSyAYiBZKx7MnpbEhh9jyipgxe19OcubqV5w
April 1, 2024
40568
Late-demographic dividend
LTE
false
2
1
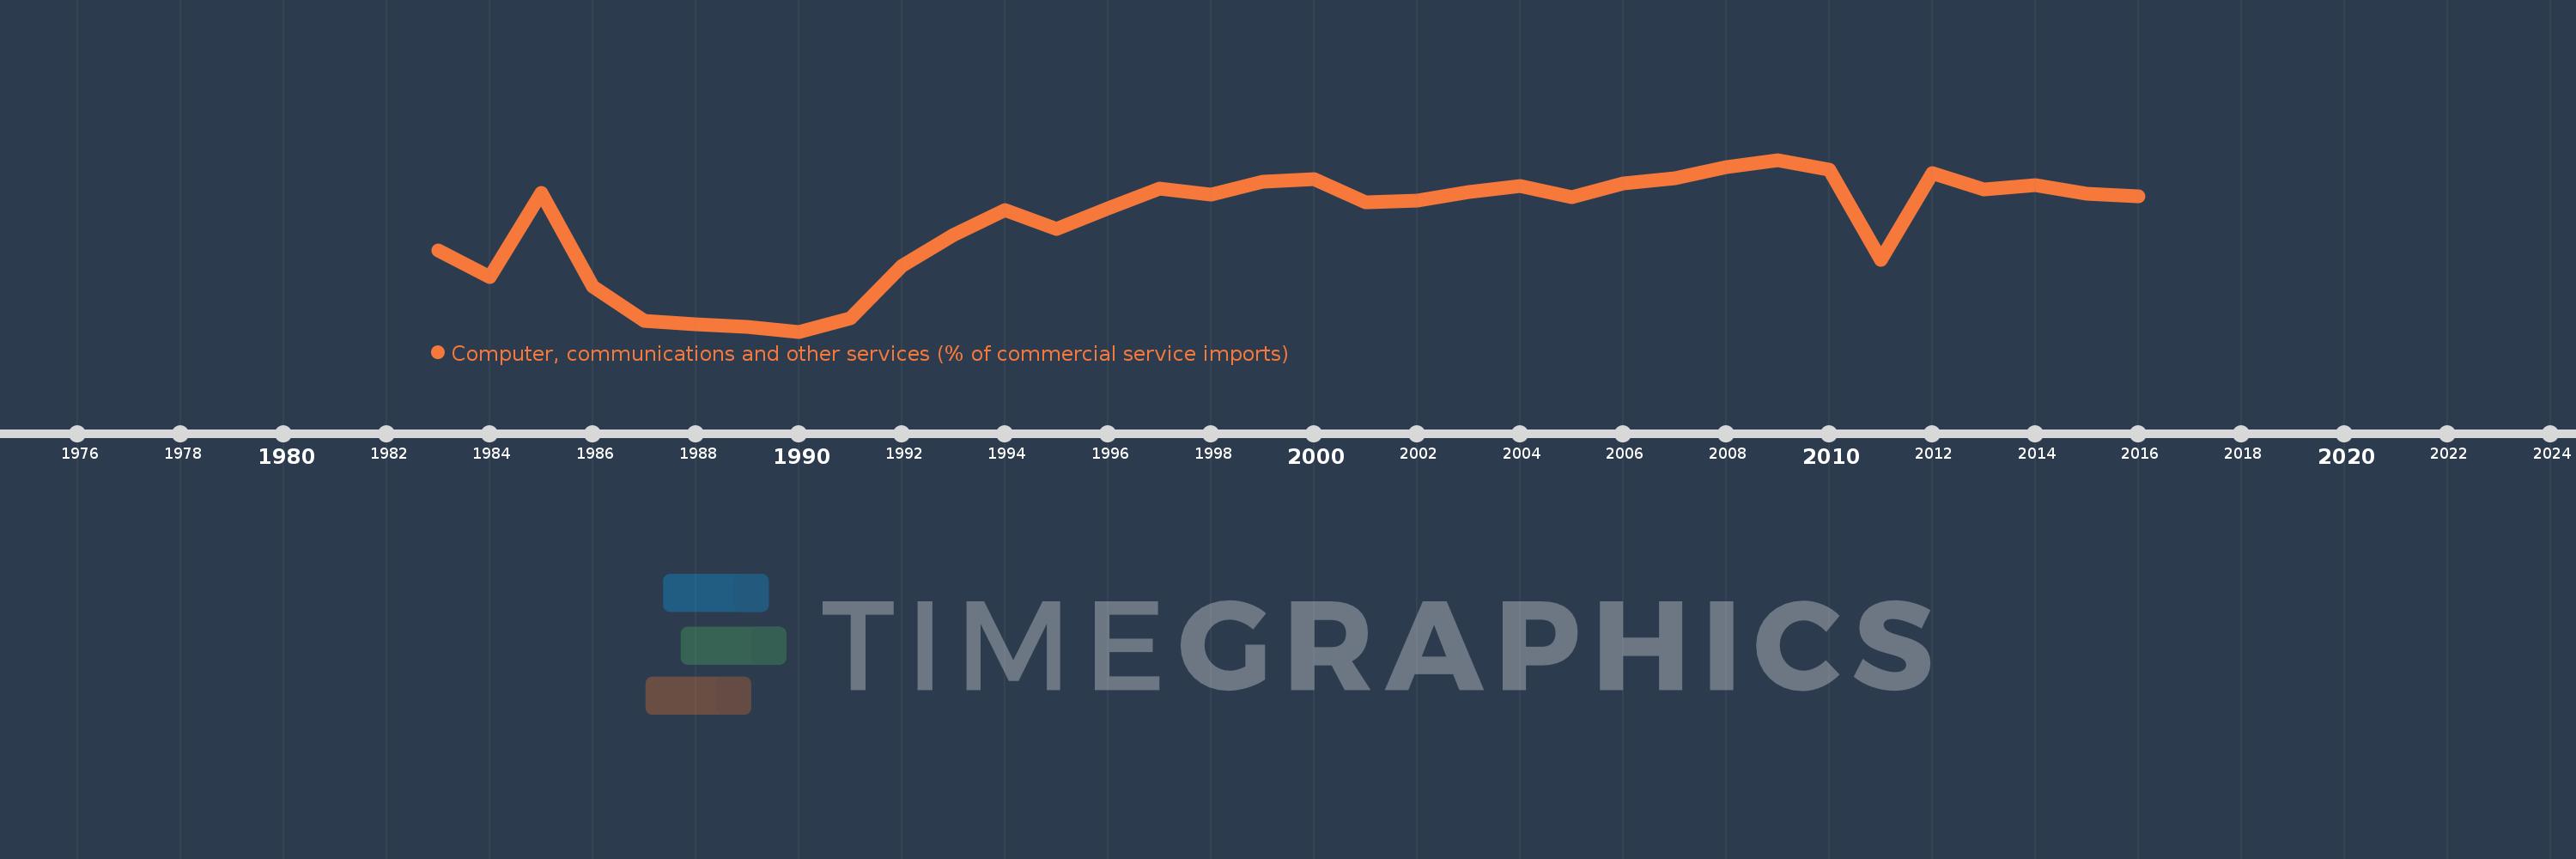
Computer, communications and other services (% of commercial service imports)
2016,2015,2014,2013,2012,2011,2010,2009,2008,2007,2006,2005,2004,2003,2002,2001,2000,1999,1998,1997,1996,1995,1994,1993,1992,1991,1990,1989,1988,1987,1986,1985,1984,1983
This statistics in other country:
AfghanistanAlbaniaAlgeriaAngolaAntigua and BarbudaArab WorldArgentinaArmeniaArubaAustraliaAustriaAzerbaijanBahamas, TheBahrainBangladeshBarbadosBelarusBelgiumBelizeBeninBermudaBhutanBoliviaBosnia and HerzegovinaBotswanaBrazilBrunei DarussalamBulgariaBurkina FasoBurundiCabo VerdeCambodiaCameroonCanadaCaribbean small statesCentral African RepublicCentral Europe and the BalticsChadChileChinaColombiaComorosCongo, Dem. Rep.Congo, Rep.Costa RicaCote d'IvoireCroatiaCuracaoCyprusCzech RepublicDenmarkDjiboutiDominicaDominican RepublicEarly-demographic dividendEast Asia & PacificEast Asia & Pacific (excluding high income)East Asia & Pacific (IDA & IBRD countries)EcuadorEgypt, Arab Rep.El SalvadorEquatorial GuineaEritreaEstoniaEthiopiaEuro areaEurope & Central AsiaEurope & Central Asia (excluding high income)Europe & Central Asia (IDA & IBRD countries)European UnionFaroe IslandsFijiFinlandFragile and conflict affected situationsFranceFrench PolynesiaGabonGambia, TheGeorgiaGermanyGhanaGreeceGrenadaGuatemalaGuineaGuinea-BissauGuyanaHaitiHeavily indebted poor countries (HIPC)High incomeHondurasHong Kong SAR, ChinaHungaryIBRD onlyIcelandIDA & IBRD totalIDA onlyIDA totalIndiaIndonesiaIran, Islamic Rep.IraqIrelandIsraelItalyJamaicaJapanJordanKazakhstanKenyaKiribatiKorea, Rep.KosovoKuwaitKyrgyz RepublicLao PDRLate-demographic dividendLatin America & Caribbean Latin America & Caribbean (excluding high income)Latin America & the Caribbean (IDA & IBRD countries)LatviaLeast developed countries: UN classificationLebanonLesothoLiberiaLibyaLithuaniaLow & middle incomeLow incomeLower middle incomeLuxembourgMacao SAR, ChinaMacedonia, FYRMadagascarMalawiMalaysiaMaldivesMaliMaltaMarshall IslandsMauritaniaMauritiusMexicoMicronesia, Fed. Sts.Middle East & North AfricaMiddle East & North Africa (excluding high income)Middle East & North Africa (IDA & IBRD countries)Middle incomeMoldovaMongoliaMontenegroMoroccoMozambiqueMyanmarNamibiaNepalNetherlandsNew CaledoniaNew ZealandNicaraguaNigerNigeriaNorth AmericaNorwayOECD membersOmanOther small statesPacific island small statesPakistanPalauPanamaPapua New GuineaParaguayPeruPhilippinesPolandPortugalPost-demographic dividendPre-demographic dividendQatarRomaniaRussian FederationRwandaSamoaSao Tome and PrincipeSaudi ArabiaSenegalSerbiaSeychellesSierra LeoneSingaporeSint Maarten (Dutch part)Slovak RepublicSloveniaSmall statesSolomon IslandsSouth AfricaSouth AsiaSouth Asia (IDA & IBRD)South SudanSpainSri LankaSt. Kitts and NevisSt. LuciaSt. Vincent and the GrenadinesSub-Saharan Africa Sub-Saharan Africa (excluding high income)Sub-Saharan Africa (IDA & IBRD countries)SudanSurinameSwazilandSwedenSwitzerlandSyrian Arab RepublicTajikistanTanzaniaThailandTimor-LesteTogoTongaTrinidad and TobagoTunisiaTurkeyTuvaluUgandaUkraineUnited KingdomUnited StatesUpper middle incomeUruguayVanuatuVenezuela, RBWest Bank and GazaWorldYemen, Rep.ZambiaZimbabwe Timeline:
This timeline shows a graph from 1983 to 2016 of Late-demographic dividend. No data until 1982. Number of actual observations by date: 34.
Source name:
World Development Indicators
Source organization:
International Monetary Fund, Balance of Payments Statistics Yearbook and data files.
Categories, topics:
Private Sector, Trade
Last updated:
apr 23, 2017
Indicators value changes by year
Minimum:
12.732
jan 1, 1990
Maximum:
37.556
jan 1, 2009
At the date of observation
Value
Absolute change
Change from previous value
jan 1, 1983
24.435
+24.435
0.0%
jan 1, 1984
20.646
-3.789
-15.51%
jan 1, 1985
32.756
+12.11
58.66%
jan 1, 1986
19.263
-13.493
-41.19%
jan 1, 1987
14.311
-4.952
-25.71%
jan 1, 1988
13.75
-0.56
-3.92%
jan 1, 1989
13.465
-0.286
-2.08%
jan 1, 1990
12.732
-0.733
-5.44%
jan 1, 1991
14.615
+1.883
14.79%
jan 1, 1992
22.235
+7.62
52.14%
jan 1, 1993
26.66
+4.425
19.9%
jan 1, 1994
30.278
+3.618
13.57%
jan 1, 1995
27.6
-2.677
-8.84%
jan 1, 1996
30.582
+2.982
10.8%
jan 1, 1997
33.348
+2.766
9.04%
jan 1, 1998
32.557
-0.791
-2.37%
jan 1, 1999
34.443
+1.886
5.79%
jan 1, 2000
34.784
+0.341
0.99%
jan 1, 2001
31.38
-3.404
-9.79%
jan 1, 2002
31.712
+0.332
1.06%
jan 1, 2003
32.852
+1.14
3.59%
jan 1, 2004
33.766
+0.914
2.78%
jan 1, 2005
32.157
-1.609
-4.77%
jan 1, 2006
34.174
+2.017
6.27%
jan 1, 2007
34.877
+0.703
2.06%
jan 1, 2008
36.54
+1.663
4.77%
jan 1, 2009
37.556
+1.016
2.78%
jan 1, 2010
36.141
-1.415
-3.77%
jan 1, 2011
23.079
-13.062
-36.14%
jan 1, 2012
35.584
+12.505
54.18%
jan 1, 2013
33.265
-2.319
-6.52%
jan 1, 2014
33.955
+0.69
2.08%
jan 1, 2015
32.683
-1.273
-3.75%
jan 1, 2016
32.329
-0.354
-1.08%
Ranking of countries by current statistics by years


Comments: