29
/
en
AIzaSyAYiBZKx7MnpbEhh9jyipgxe19OcubqV5w
April 1, 2024
133935
France
FRA
true
2
1
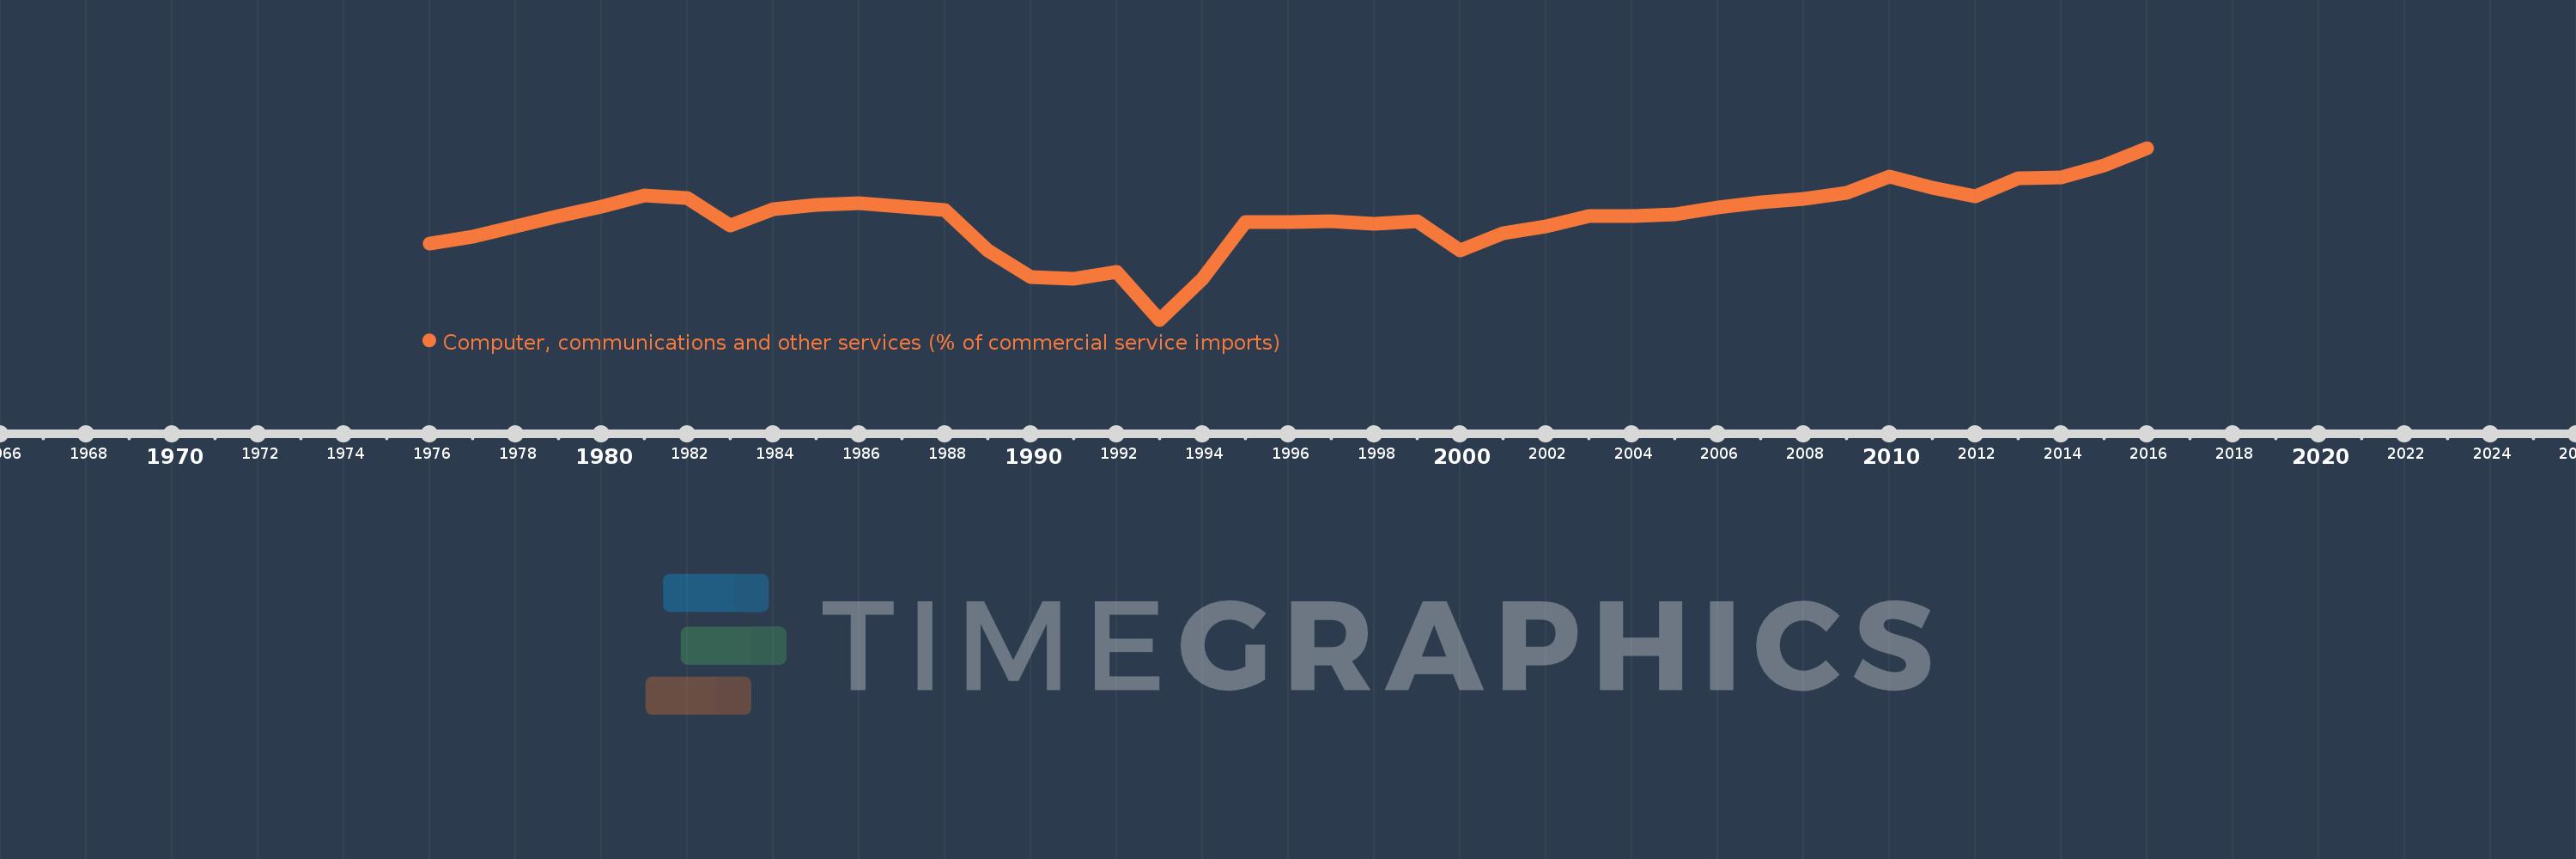
Computer, communications and other services (% of commercial service imports)
2016,2015,2014,2013,2012,2011,2010,2009,2008,2007,2006,2005,2004,2003,2002,2001,2000,1999,1998,1997,1996,1995,1994,1993,1992,1991,1990,1989,1988,1987,1986,1985,1984,1983,1982,1981,1980,1979,1978,1977,1976
This statistics in other country:
AfghanistanAlbaniaAlgeriaAngolaAntigua and BarbudaArab WorldArgentinaArmeniaArubaAustraliaAustriaAzerbaijanBahamas, TheBahrainBangladeshBarbadosBelarusBelgiumBelizeBeninBermudaBhutanBoliviaBosnia and HerzegovinaBotswanaBrazilBrunei DarussalamBulgariaBurkina FasoBurundiCabo VerdeCambodiaCameroonCanadaCaribbean small statesCentral African RepublicCentral Europe and the BalticsChadChileChinaColombiaComorosCongo, Dem. Rep.Congo, Rep.Costa RicaCote d'IvoireCroatiaCuracaoCyprusCzech RepublicDenmarkDjiboutiDominicaDominican RepublicEarly-demographic dividendEast Asia & PacificEast Asia & Pacific (excluding high income)East Asia & Pacific (IDA & IBRD countries)EcuadorEgypt, Arab Rep.El SalvadorEquatorial GuineaEritreaEstoniaEthiopiaEuro areaEurope & Central AsiaEurope & Central Asia (excluding high income)Europe & Central Asia (IDA & IBRD countries)European UnionFaroe IslandsFijiFinlandFragile and conflict affected situationsFranceFrench PolynesiaGabonGambia, TheGeorgiaGermanyGhanaGreeceGrenadaGuatemalaGuineaGuinea-BissauGuyanaHaitiHeavily indebted poor countries (HIPC)High incomeHondurasHong Kong SAR, ChinaHungaryIBRD onlyIcelandIDA & IBRD totalIDA onlyIDA totalIndiaIndonesiaIran, Islamic Rep.IraqIrelandIsraelItalyJamaicaJapanJordanKazakhstanKenyaKiribatiKorea, Rep.KosovoKuwaitKyrgyz RepublicLao PDRLate-demographic dividendLatin America & Caribbean Latin America & Caribbean (excluding high income)Latin America & the Caribbean (IDA & IBRD countries)LatviaLeast developed countries: UN classificationLebanonLesothoLiberiaLibyaLithuaniaLow & middle incomeLow incomeLower middle incomeLuxembourgMacao SAR, ChinaMacedonia, FYRMadagascarMalawiMalaysiaMaldivesMaliMaltaMarshall IslandsMauritaniaMauritiusMexicoMicronesia, Fed. Sts.Middle East & North AfricaMiddle East & North Africa (excluding high income)Middle East & North Africa (IDA & IBRD countries)Middle incomeMoldovaMongoliaMontenegroMoroccoMozambiqueMyanmarNamibiaNepalNetherlandsNew CaledoniaNew ZealandNicaraguaNigerNigeriaNorth AmericaNorwayOECD membersOmanOther small statesPacific island small statesPakistanPalauPanamaPapua New GuineaParaguayPeruPhilippinesPolandPortugalPost-demographic dividendPre-demographic dividendQatarRomaniaRussian FederationRwandaSamoaSao Tome and PrincipeSaudi ArabiaSenegalSerbiaSeychellesSierra LeoneSingaporeSint Maarten (Dutch part)Slovak RepublicSloveniaSmall statesSolomon IslandsSouth AfricaSouth AsiaSouth Asia (IDA & IBRD)South SudanSpainSri LankaSt. Kitts and NevisSt. LuciaSt. Vincent and the GrenadinesSub-Saharan Africa Sub-Saharan Africa (excluding high income)Sub-Saharan Africa (IDA & IBRD countries)SudanSurinameSwazilandSwedenSwitzerlandSyrian Arab RepublicTajikistanTanzaniaThailandTimor-LesteTogoTongaTrinidad and TobagoTunisiaTurkeyTuvaluUgandaUkraineUnited KingdomUnited StatesUpper middle incomeUruguayVanuatuVenezuela, RBWest Bank and GazaWorldYemen, Rep.ZambiaZimbabwe Timeline:
This timeline shows a graph from 1976 to 2016 of France. No data until 1975. Number of actual observations by date: 41.
Source name:
World Development Indicators
Source organization:
International Monetary Fund, Balance of Payments Statistics Yearbook and data files.
Categories, topics:
Private Sector, Trade
Last updated:
apr 23, 2017
Indicators value changes by year
Minimum:
24.169
jan 1, 1993
Maximum:
57.577
jan 1, 2016
At the date of observation
Value
Absolute change
Change from previous value
jan 1, 1976
38.966
+38.966
0.0%
jan 1, 1977
40.394
+1.428
3.67%
jan 1, 1978
42.362
+1.968
4.87%
jan 1, 1979
44.407
+2.045
4.83%
jan 1, 1980
46.096
+1.69
3.8%
jan 1, 1981
48.328
+2.231
4.84%
jan 1, 1982
47.861
-0.466
-0.96%
jan 1, 1983
42.435
-5.427
-11.34%
jan 1, 1984
45.69
+3.255
7.67%
jan 1, 1985
46.564
+0.874
1.91%
jan 1, 1986
46.8
+0.236
0.51%
jan 1, 1987
46.142
-0.658
-1.41%
jan 1, 1988
45.569
-0.573
-1.24%
jan 1, 1989
37.629
-7.939
-17.42%
jan 1, 1990
32.476
-5.154
-13.7%
jan 1, 1991
32.203
-0.273
-0.84%
jan 1, 1992
33.472
+1.269
3.94%
jan 1, 1993
24.169
-9.304
-27.79%
jan 1, 1994
32.07
+7.902
32.69%
jan 1, 1995
43.083
+11.013
34.34%
jan 1, 1996
43.085
+0.002
0.0%
jan 1, 1997
43.311
+0.226
0.52%
jan 1, 1998
42.789
-0.522
-1.2%
jan 1, 1999
43.364
+0.576
1.35%
jan 1, 2000
37.668
-5.696
-13.14%
jan 1, 2001
41.069
+3.401
9.03%
jan 1, 2002
42.292
+1.222
2.98%
jan 1, 2003
44.335
+2.043
4.83%
jan 1, 2004
44.304
-0.032
-0.07%
jan 1, 2005
44.718
+0.414
0.93%
jan 1, 2006
46.011
+1.294
2.89%
jan 1, 2007
47.035
+1.023
2.22%
jan 1, 2008
47.746
+0.711
1.51%
jan 1, 2009
48.84
+1.094
2.29%
jan 1, 2010
51.938
+3.098
6.34%
jan 1, 2011
49.9
-2.039
-3.93%
jan 1, 2012
48.227
-1.673
-3.35%
jan 1, 2013
51.67
+3.443
7.14%
jan 1, 2014
51.839
+0.17
0.33%
jan 1, 2015
54.261
+2.422
4.67%
jan 1, 2016
57.577
+3.316
6.11%
Ranking of countries by current statistics by years


Comments: