29
/
en
AIzaSyAYiBZKx7MnpbEhh9jyipgxe19OcubqV5w
April 1, 2024
118742
Denmark
DNK
true
2
1
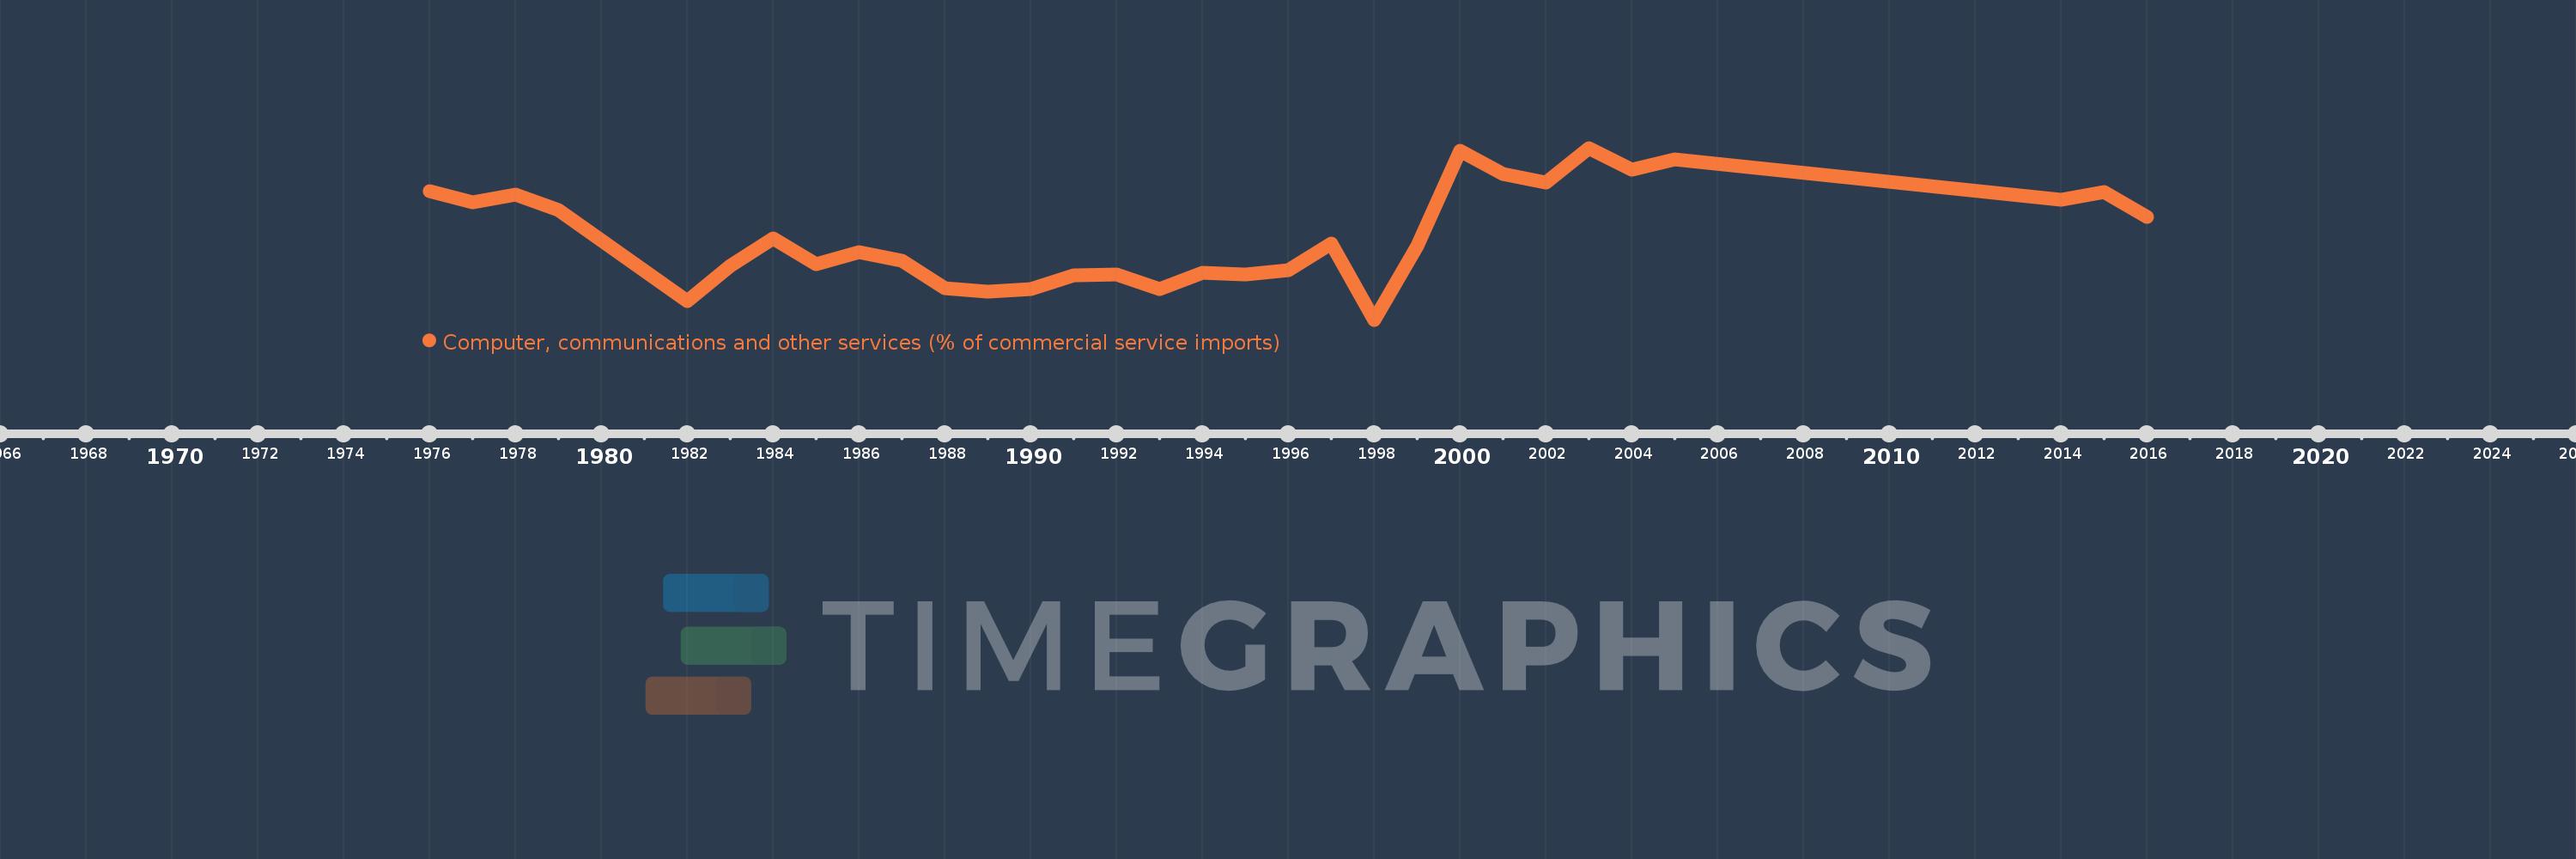
Computer, communications and other services (% of commercial service imports)
2016,2015,2014,2005,2004,2003,2002,2001,2000,1999,1998,1997,1996,1995,1994,1993,1992,1991,1990,1989,1988,1987,1986,1985,1984,1983,1982,1979,1978,1977,1976
This statistics in other country:
AfghanistanAlbaniaAlgeriaAngolaAntigua and BarbudaArab WorldArgentinaArmeniaArubaAustraliaAustriaAzerbaijanBahamas, TheBahrainBangladeshBarbadosBelarusBelgiumBelizeBeninBermudaBhutanBoliviaBosnia and HerzegovinaBotswanaBrazilBrunei DarussalamBulgariaBurkina FasoBurundiCabo VerdeCambodiaCameroonCanadaCaribbean small statesCentral African RepublicCentral Europe and the BalticsChadChileChinaColombiaComorosCongo, Dem. Rep.Congo, Rep.Costa RicaCote d'IvoireCroatiaCuracaoCyprusCzech RepublicDenmarkDjiboutiDominicaDominican RepublicEarly-demographic dividendEast Asia & PacificEast Asia & Pacific (excluding high income)East Asia & Pacific (IDA & IBRD countries)EcuadorEgypt, Arab Rep.El SalvadorEquatorial GuineaEritreaEstoniaEthiopiaEuro areaEurope & Central AsiaEurope & Central Asia (excluding high income)Europe & Central Asia (IDA & IBRD countries)European UnionFaroe IslandsFijiFinlandFragile and conflict affected situationsFranceFrench PolynesiaGabonGambia, TheGeorgiaGermanyGhanaGreeceGrenadaGuatemalaGuineaGuinea-BissauGuyanaHaitiHeavily indebted poor countries (HIPC)High incomeHondurasHong Kong SAR, ChinaHungaryIBRD onlyIcelandIDA & IBRD totalIDA onlyIDA totalIndiaIndonesiaIran, Islamic Rep.IraqIrelandIsraelItalyJamaicaJapanJordanKazakhstanKenyaKiribatiKorea, Rep.KosovoKuwaitKyrgyz RepublicLao PDRLate-demographic dividendLatin America & Caribbean Latin America & Caribbean (excluding high income)Latin America & the Caribbean (IDA & IBRD countries)LatviaLeast developed countries: UN classificationLebanonLesothoLiberiaLibyaLithuaniaLow & middle incomeLow incomeLower middle incomeLuxembourgMacao SAR, ChinaMacedonia, FYRMadagascarMalawiMalaysiaMaldivesMaliMaltaMarshall IslandsMauritaniaMauritiusMexicoMicronesia, Fed. Sts.Middle East & North AfricaMiddle East & North Africa (excluding high income)Middle East & North Africa (IDA & IBRD countries)Middle incomeMoldovaMongoliaMontenegroMoroccoMozambiqueMyanmarNamibiaNepalNetherlandsNew CaledoniaNew ZealandNicaraguaNigerNigeriaNorth AmericaNorwayOECD membersOmanOther small statesPacific island small statesPakistanPalauPanamaPapua New GuineaParaguayPeruPhilippinesPolandPortugalPost-demographic dividendPre-demographic dividendQatarRomaniaRussian FederationRwandaSamoaSao Tome and PrincipeSaudi ArabiaSenegalSerbiaSeychellesSierra LeoneSingaporeSint Maarten (Dutch part)Slovak RepublicSloveniaSmall statesSolomon IslandsSouth AfricaSouth AsiaSouth Asia (IDA & IBRD)South SudanSpainSri LankaSt. Kitts and NevisSt. LuciaSt. Vincent and the GrenadinesSub-Saharan Africa Sub-Saharan Africa (excluding high income)Sub-Saharan Africa (IDA & IBRD countries)SudanSurinameSwazilandSwedenSwitzerlandSyrian Arab RepublicTajikistanTanzaniaThailandTimor-LesteTogoTongaTrinidad and TobagoTunisiaTurkeyTuvaluUgandaUkraineUnited KingdomUnited StatesUpper middle incomeUruguayVanuatuVenezuela, RBWest Bank and GazaWorldYemen, Rep.ZambiaZimbabwe Timeline:
This timeline shows a graph from 1976 to 2016 of Denmark. No data until 1975. Number of actual observations by date: 31.
Source name:
World Development Indicators
Source organization:
International Monetary Fund, Balance of Payments Statistics Yearbook and data files.
Categories, topics:
Private Sector, Trade
Last updated:
apr 23, 2017
Indicators value changes by year
Minimum:
19.354
jan 1, 1998
Maximum:
35.991
jan 1, 2003
At the date of observation
Value
Absolute change
Change from previous value
jan 1, 1976
31.835
+31.835
0.0%
jan 1, 1977
30.751
-1.084
-3.4%
jan 1, 1978
31.512
+0.761
2.47%
jan 1, 1979
29.988
-1.524
-4.84%
jan 1, 1982
21.195
-8.793
-29.32%
jan 1, 1983
24.576
+3.381
15.95%
jan 1, 1984
27.266
+2.69
10.94%
jan 1, 1985
24.758
-2.508
-9.2%
jan 1, 1986
25.927
+1.169
4.72%
jan 1, 1987
25.061
-0.865
-3.34%
jan 1, 1988
22.378
-2.683
-10.71%
jan 1, 1989
22.066
-0.312
-1.39%
jan 1, 1990
22.319
+0.253
1.14%
jan 1, 1991
23.619
+1.301
5.83%
jan 1, 1992
23.709
+0.089
0.38%
jan 1, 1993
22.288
-1.421
-5.99%
jan 1, 1994
23.917
+1.628
7.31%
jan 1, 1995
23.732
-0.185
-0.77%
jan 1, 1996
24.122
+0.39
1.64%
jan 1, 1997
26.772
+2.65
10.99%
jan 1, 1998
19.354
-7.418
-27.71%
jan 1, 1999
26.476
+7.122
36.8%
jan 1, 2000
35.743
+9.267
35.0%
jan 1, 2001
33.466
-2.277
-6.37%
jan 1, 2002
32.658
-0.809
-2.42%
jan 1, 2003
35.991
+3.333
10.21%
jan 1, 2004
33.864
-2.126
-5.91%
jan 1, 2005
34.844
+0.98
2.89%
jan 1, 2014
30.965
-3.879
-11.13%
jan 1, 2015
31.76
+0.795
2.57%
jan 1, 2016
29.276
-2.484
-7.82%
Ranking of countries by current statistics by years


Comments: