29
/
en
AIzaSyAYiBZKx7MnpbEhh9jyipgxe19OcubqV5w
April 1, 2024
59620
Sub-Saharan Africa (excluding high income)
SSA
false
2
1
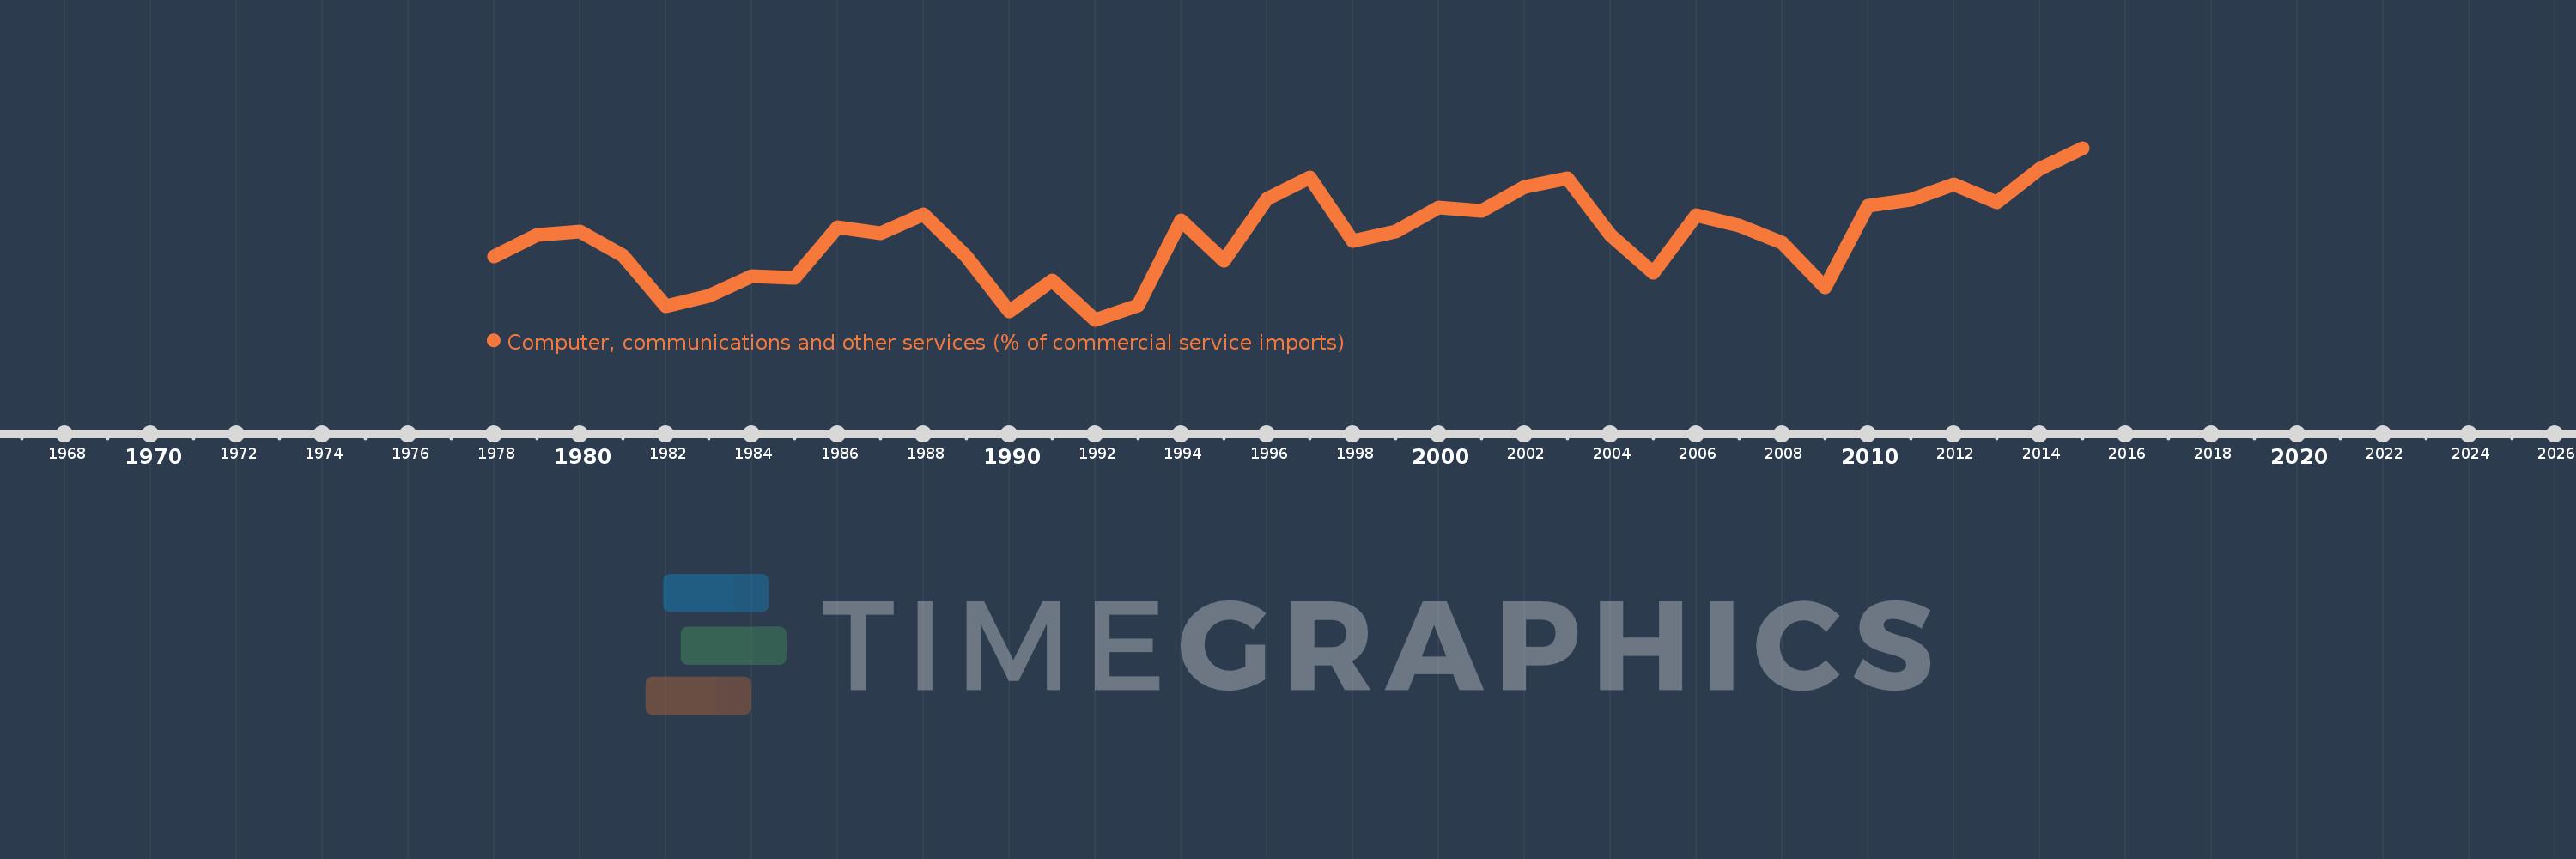
Computer, communications and other services (% of commercial service imports)
2015,2014,2013,2012,2011,2010,2009,2008,2007,2006,2005,2004,2003,2002,2001,2000,1999,1998,1997,1996,1995,1994,1993,1992,1991,1990,1989,1988,1987,1986,1985,1984,1983,1982,1981,1980,1979,1978
This statistics in other country:
AfghanistanAlbaniaAlgeriaAngolaAntigua and BarbudaArab WorldArgentinaArmeniaArubaAustraliaAustriaAzerbaijanBahamas, TheBahrainBangladeshBarbadosBelarusBelgiumBelizeBeninBermudaBhutanBoliviaBosnia and HerzegovinaBotswanaBrazilBrunei DarussalamBulgariaBurkina FasoBurundiCabo VerdeCambodiaCameroonCanadaCaribbean small statesCentral African RepublicCentral Europe and the BalticsChadChileChinaColombiaComorosCongo, Dem. Rep.Congo, Rep.Costa RicaCote d'IvoireCroatiaCuracaoCyprusCzech RepublicDenmarkDjiboutiDominicaDominican RepublicEarly-demographic dividendEast Asia & PacificEast Asia & Pacific (excluding high income)East Asia & Pacific (IDA & IBRD countries)EcuadorEgypt, Arab Rep.El SalvadorEquatorial GuineaEritreaEstoniaEthiopiaEuro areaEurope & Central AsiaEurope & Central Asia (excluding high income)Europe & Central Asia (IDA & IBRD countries)European UnionFaroe IslandsFijiFinlandFragile and conflict affected situationsFranceFrench PolynesiaGabonGambia, TheGeorgiaGermanyGhanaGreeceGrenadaGuatemalaGuineaGuinea-BissauGuyanaHaitiHeavily indebted poor countries (HIPC)High incomeHondurasHong Kong SAR, ChinaHungaryIBRD onlyIcelandIDA & IBRD totalIDA onlyIDA totalIndiaIndonesiaIran, Islamic Rep.IraqIrelandIsraelItalyJamaicaJapanJordanKazakhstanKenyaKiribatiKorea, Rep.KosovoKuwaitKyrgyz RepublicLao PDRLate-demographic dividendLatin America & Caribbean Latin America & Caribbean (excluding high income)Latin America & the Caribbean (IDA & IBRD countries)LatviaLeast developed countries: UN classificationLebanonLesothoLiberiaLibyaLithuaniaLow & middle incomeLow incomeLower middle incomeLuxembourgMacao SAR, ChinaMacedonia, FYRMadagascarMalawiMalaysiaMaldivesMaliMaltaMarshall IslandsMauritaniaMauritiusMexicoMicronesia, Fed. Sts.Middle East & North AfricaMiddle East & North Africa (excluding high income)Middle East & North Africa (IDA & IBRD countries)Middle incomeMoldovaMongoliaMontenegroMoroccoMozambiqueMyanmarNamibiaNepalNetherlandsNew CaledoniaNew ZealandNicaraguaNigerNigeriaNorth AmericaNorwayOECD membersOmanOther small statesPacific island small statesPakistanPalauPanamaPapua New GuineaParaguayPeruPhilippinesPolandPortugalPost-demographic dividendPre-demographic dividendQatarRomaniaRussian FederationRwandaSamoaSao Tome and PrincipeSaudi ArabiaSenegalSerbiaSeychellesSierra LeoneSingaporeSint Maarten (Dutch part)Slovak RepublicSloveniaSmall statesSolomon IslandsSouth AfricaSouth AsiaSouth Asia (IDA & IBRD)South SudanSpainSri LankaSt. Kitts and NevisSt. LuciaSt. Vincent and the GrenadinesSub-Saharan Africa Sub-Saharan Africa (excluding high income)Sub-Saharan Africa (IDA & IBRD countries)SudanSurinameSwazilandSwedenSwitzerlandSyrian Arab RepublicTajikistanTanzaniaThailandTimor-LesteTogoTongaTrinidad and TobagoTunisiaTurkeyTuvaluUgandaUkraineUnited KingdomUnited StatesUpper middle incomeUruguayVanuatuVenezuela, RBWest Bank and GazaWorldYemen, Rep.ZambiaZimbabwe Timeline:
This timeline shows a graph from 1978 to 2015 of Sub-Saharan Africa (excluding high income). No data until 1977. Number of actual observations by date: 38.
Source name:
World Development Indicators
Source organization:
International Monetary Fund, Balance of Payments Statistics Yearbook and data files.
Categories, topics:
Private Sector, Trade
Last updated:
apr 23, 2017
Indicators value changes by year
Minimum:
22.935
jan 1, 1992
Maximum:
33.782
jan 1, 2015
At the date of observation
Value
Absolute change
Change from previous value
jan 1, 1978
26.938
+26.938
0.0%
jan 1, 1979
28.312
+1.374
5.1%
jan 1, 1980
28.514
+0.202
0.71%
jan 1, 1981
27.002
-1.512
-5.3%
jan 1, 1982
23.785
-3.217
-11.91%
jan 1, 1983
24.457
+0.672
2.83%
jan 1, 1984
25.665
+1.208
4.94%
jan 1, 1985
25.578
-0.087
-0.34%
jan 1, 1986
28.758
+3.179
12.43%
jan 1, 1987
28.391
-0.367
-1.28%
jan 1, 1988
29.608
+1.217
4.29%
jan 1, 1989
26.934
-2.673
-9.03%
jan 1, 1990
23.483
-3.451
-12.81%
jan 1, 1991
25.39
+1.907
8.12%
jan 1, 1992
22.935
-2.455
-9.67%
jan 1, 1993
23.865
+0.93
4.05%
jan 1, 1994
29.198
+5.333
22.35%
jan 1, 1995
26.641
-2.557
-8.76%
jan 1, 1996
30.565
+3.924
14.73%
jan 1, 1997
31.913
+1.348
4.41%
jan 1, 1998
27.884
-4.029
-12.63%
jan 1, 1999
28.481
+0.597
2.14%
jan 1, 2000
30.009
+1.528
5.36%
jan 1, 2001
29.79
-0.219
-0.73%
jan 1, 2002
31.305
+1.515
5.09%
jan 1, 2003
31.843
+0.538
1.72%
jan 1, 2004
28.275
-3.569
-11.21%
jan 1, 2005
25.912
-2.363
-8.36%
jan 1, 2006
29.524
+3.613
13.94%
jan 1, 2007
28.904
-0.62
-2.1%
jan 1, 2008
27.797
-1.107
-3.83%
jan 1, 2009
24.965
-2.832
-10.19%
jan 1, 2010
30.122
+5.158
20.66%
jan 1, 2011
30.522
+0.4
1.33%
jan 1, 2012
31.469
+0.947
3.1%
jan 1, 2013
30.328
-1.141
-3.63%
jan 1, 2014
32.44
+2.112
6.96%
jan 1, 2015
33.782
+1.342
4.14%
Ranking of countries by current statistics by years


Comments: