29
/
en
AIzaSyAYiBZKx7MnpbEhh9jyipgxe19OcubqV5w
April 1, 2024
216184
Pakistan
PAK
true
2
1
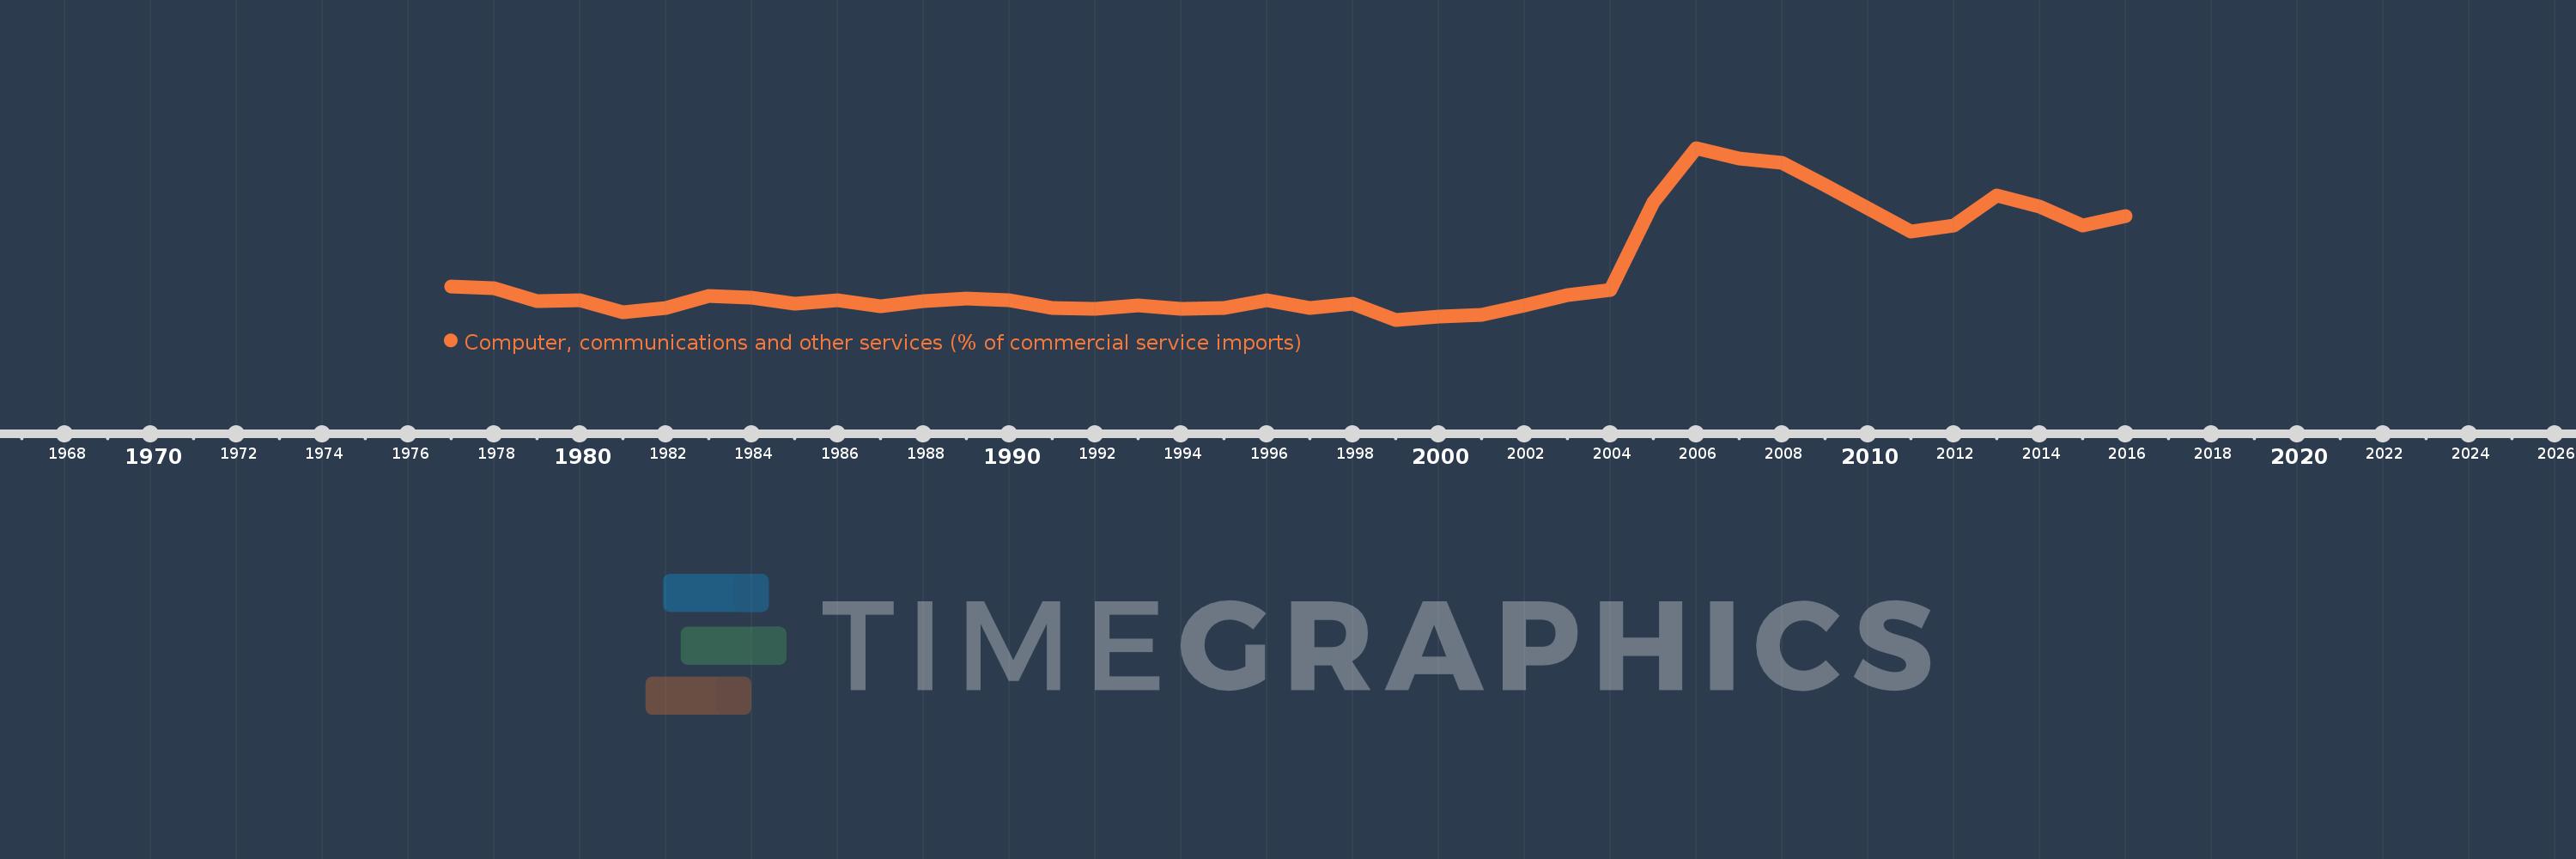
Computer, communications and other services (% of commercial service imports)
2016,2015,2014,2013,2012,2011,2010,2009,2008,2007,2006,2005,2004,2003,2002,2001,2000,1999,1998,1997,1996,1995,1994,1993,1992,1991,1990,1989,1988,1987,1986,1985,1984,1983,1982,1981,1980,1979,1978,1977
This statistics in other country:
AfghanistanAlbaniaAlgeriaAngolaAntigua and BarbudaArab WorldArgentinaArmeniaArubaAustraliaAustriaAzerbaijanBahamas, TheBahrainBangladeshBarbadosBelarusBelgiumBelizeBeninBermudaBhutanBoliviaBosnia and HerzegovinaBotswanaBrazilBrunei DarussalamBulgariaBurkina FasoBurundiCabo VerdeCambodiaCameroonCanadaCaribbean small statesCentral African RepublicCentral Europe and the BalticsChadChileChinaColombiaComorosCongo, Dem. Rep.Congo, Rep.Costa RicaCote d'IvoireCroatiaCuracaoCyprusCzech RepublicDenmarkDjiboutiDominicaDominican RepublicEarly-demographic dividendEast Asia & PacificEast Asia & Pacific (excluding high income)East Asia & Pacific (IDA & IBRD countries)EcuadorEgypt, Arab Rep.El SalvadorEquatorial GuineaEritreaEstoniaEthiopiaEuro areaEurope & Central AsiaEurope & Central Asia (excluding high income)Europe & Central Asia (IDA & IBRD countries)European UnionFaroe IslandsFijiFinlandFragile and conflict affected situationsFranceFrench PolynesiaGabonGambia, TheGeorgiaGermanyGhanaGreeceGrenadaGuatemalaGuineaGuinea-BissauGuyanaHaitiHeavily indebted poor countries (HIPC)High incomeHondurasHong Kong SAR, ChinaHungaryIBRD onlyIcelandIDA & IBRD totalIDA onlyIDA totalIndiaIndonesiaIran, Islamic Rep.IraqIrelandIsraelItalyJamaicaJapanJordanKazakhstanKenyaKiribatiKorea, Rep.KosovoKuwaitKyrgyz RepublicLao PDRLate-demographic dividendLatin America & Caribbean Latin America & Caribbean (excluding high income)Latin America & the Caribbean (IDA & IBRD countries)LatviaLeast developed countries: UN classificationLebanonLesothoLiberiaLibyaLithuaniaLow & middle incomeLow incomeLower middle incomeLuxembourgMacao SAR, ChinaMacedonia, FYRMadagascarMalawiMalaysiaMaldivesMaliMaltaMarshall IslandsMauritaniaMauritiusMexicoMicronesia, Fed. Sts.Middle East & North AfricaMiddle East & North Africa (excluding high income)Middle East & North Africa (IDA & IBRD countries)Middle incomeMoldovaMongoliaMontenegroMoroccoMozambiqueMyanmarNamibiaNepalNetherlandsNew CaledoniaNew ZealandNicaraguaNigerNigeriaNorth AmericaNorwayOECD membersOmanOther small statesPacific island small statesPakistanPalauPanamaPapua New GuineaParaguayPeruPhilippinesPolandPortugalPost-demographic dividendPre-demographic dividendQatarRomaniaRussian FederationRwandaSamoaSao Tome and PrincipeSaudi ArabiaSenegalSerbiaSeychellesSierra LeoneSingaporeSint Maarten (Dutch part)Slovak RepublicSloveniaSmall statesSolomon IslandsSouth AfricaSouth AsiaSouth Asia (IDA & IBRD)South SudanSpainSri LankaSt. Kitts and NevisSt. LuciaSt. Vincent and the GrenadinesSub-Saharan Africa Sub-Saharan Africa (excluding high income)Sub-Saharan Africa (IDA & IBRD countries)SudanSurinameSwazilandSwedenSwitzerlandSyrian Arab RepublicTajikistanTanzaniaThailandTimor-LesteTogoTongaTrinidad and TobagoTunisiaTurkeyTuvaluUgandaUkraineUnited KingdomUnited StatesUpper middle incomeUruguayVanuatuVenezuela, RBWest Bank and GazaWorldYemen, Rep.ZambiaZimbabwe Timeline:
This timeline shows a graph from 1977 to 2016 of Pakistan. No data until 1976. Number of actual observations by date: 40.
Source name:
World Development Indicators
Source organization:
International Monetary Fund, Balance of Payments Statistics Yearbook and data files.
Categories, topics:
Private Sector, Trade
Last updated:
apr 23, 2017
Indicators value changes by year
Maximum:
43.004
jan 1, 2006
At the date of observation
Value
Absolute change
Change from previous value
jan 1, 1977
13.175
+13.175
0.0%
jan 1, 1978
12.924
-0.251
-1.9%
jan 1, 1979
10.08
-2.844
-22.0%
jan 1, 1980
10.281
+0.2
1.98%
jan 1, 1981
7.757
-2.523
-24.54%
jan 1, 1982
8.639
+0.881
11.36%
jan 1, 1983
11.134
+2.496
28.89%
jan 1, 1984
10.855
-0.279
-2.51%
jan 1, 1985
9.549
-1.306
-12.03%
jan 1, 1986
10.177
+0.628
6.57%
jan 1, 1987
8.964
-1.213
-11.92%
jan 1, 1988
10.005
+1.041
11.61%
jan 1, 1989
10.538
+0.533
5.33%
jan 1, 1990
10.223
-0.315
-2.99%
jan 1, 1991
8.565
-1.658
-16.22%
jan 1, 1992
8.419
-0.145
-1.7%
jan 1, 1993
9.146
+0.726
8.63%
jan 1, 1994
8.426
-0.719
-7.87%
jan 1, 1995
8.538
+0.112
1.32%
jan 1, 1996
10.328
+1.79
20.96%
jan 1, 1997
8.681
-1.646
-15.94%
jan 1, 1998
9.537
+0.855
9.85%
jan 1, 1999
6.067
-3.47
-36.38%
jan 1, 2000
6.693
+0.626
10.32%
jan 1, 2001
7.096
+0.403
6.03%
jan 1, 2002
9.156
+2.06
29.03%
jan 1, 2003
11.446
+2.29
25.01%
jan 1, 2004
12.467
+1.021
8.92%
jan 1, 2005
31.372
+18.905
151.64%
jan 1, 2006
43.004
+11.632
37.08%
jan 1, 2007
40.748
-2.256
-5.25%
jan 1, 2008
39.886
-0.863
-2.12%
jan 1, 2009
35.01
-4.876
-12.22%
jan 1, 2010
30.049
-4.961
-14.17%
jan 1, 2011
24.973
-5.076
-16.89%
jan 1, 2012
26.242
+1.269
5.08%
jan 1, 2013
32.735
+6.493
24.74%
jan 1, 2014
30.438
-2.297
-7.02%
jan 1, 2015
26.344
-4.094
-13.45%
jan 1, 2016
28.277
+1.933
7.34%
Ranking of countries by current statistics by years


Comments: