29
/
en
AIzaSyAYiBZKx7MnpbEhh9jyipgxe19OcubqV5w
April 1, 2024
142811
Grenada
GRD
true
2
1
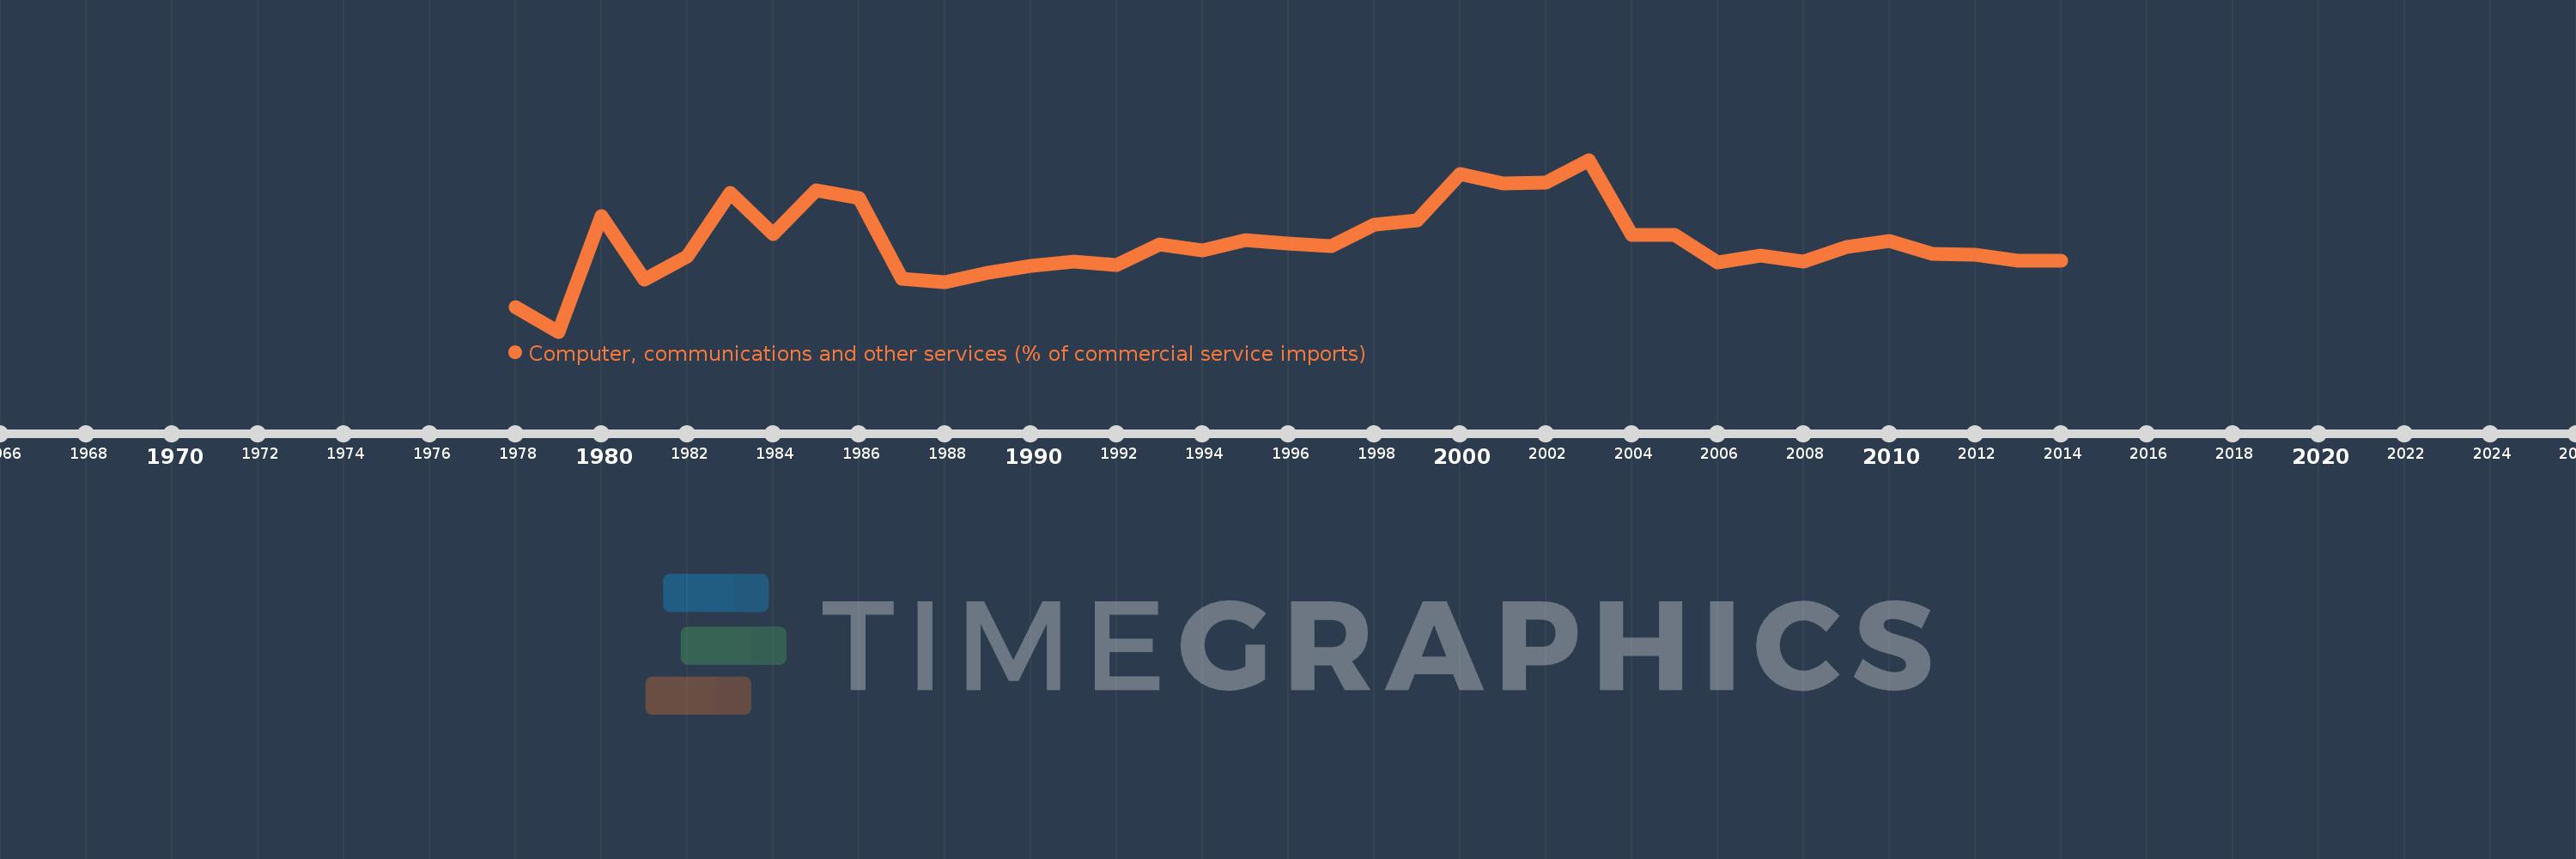
Computer, communications and other services (% of commercial service imports)
2014,2013,2012,2011,2010,2009,2008,2007,2006,2005,2004,2003,2002,2001,2000,1999,1998,1997,1996,1995,1994,1993,1992,1991,1990,1989,1988,1987,1986,1985,1984,1983,1982,1981,1980,1979,1978
This statistics in other country:
AfghanistanAlbaniaAlgeriaAngolaAntigua and BarbudaArab WorldArgentinaArmeniaArubaAustraliaAustriaAzerbaijanBahamas, TheBahrainBangladeshBarbadosBelarusBelgiumBelizeBeninBermudaBhutanBoliviaBosnia and HerzegovinaBotswanaBrazilBrunei DarussalamBulgariaBurkina FasoBurundiCabo VerdeCambodiaCameroonCanadaCaribbean small statesCentral African RepublicCentral Europe and the BalticsChadChileChinaColombiaComorosCongo, Dem. Rep.Congo, Rep.Costa RicaCote d'IvoireCroatiaCuracaoCyprusCzech RepublicDenmarkDjiboutiDominicaDominican RepublicEarly-demographic dividendEast Asia & PacificEast Asia & Pacific (excluding high income)East Asia & Pacific (IDA & IBRD countries)EcuadorEgypt, Arab Rep.El SalvadorEquatorial GuineaEritreaEstoniaEthiopiaEuro areaEurope & Central AsiaEurope & Central Asia (excluding high income)Europe & Central Asia (IDA & IBRD countries)European UnionFaroe IslandsFijiFinlandFragile and conflict affected situationsFranceFrench PolynesiaGabonGambia, TheGeorgiaGermanyGhanaGreeceGrenadaGuatemalaGuineaGuinea-BissauGuyanaHaitiHeavily indebted poor countries (HIPC)High incomeHondurasHong Kong SAR, ChinaHungaryIBRD onlyIcelandIDA & IBRD totalIDA onlyIDA totalIndiaIndonesiaIran, Islamic Rep.IraqIrelandIsraelItalyJamaicaJapanJordanKazakhstanKenyaKiribatiKorea, Rep.KosovoKuwaitKyrgyz RepublicLao PDRLate-demographic dividendLatin America & Caribbean Latin America & Caribbean (excluding high income)Latin America & the Caribbean (IDA & IBRD countries)LatviaLeast developed countries: UN classificationLebanonLesothoLiberiaLibyaLithuaniaLow & middle incomeLow incomeLower middle incomeLuxembourgMacao SAR, ChinaMacedonia, FYRMadagascarMalawiMalaysiaMaldivesMaliMaltaMarshall IslandsMauritaniaMauritiusMexicoMicronesia, Fed. Sts.Middle East & North AfricaMiddle East & North Africa (excluding high income)Middle East & North Africa (IDA & IBRD countries)Middle incomeMoldovaMongoliaMontenegroMoroccoMozambiqueMyanmarNamibiaNepalNetherlandsNew CaledoniaNew ZealandNicaraguaNigerNigeriaNorth AmericaNorwayOECD membersOmanOther small statesPacific island small statesPakistanPalauPanamaPapua New GuineaParaguayPeruPhilippinesPolandPortugalPost-demographic dividendPre-demographic dividendQatarRomaniaRussian FederationRwandaSamoaSao Tome and PrincipeSaudi ArabiaSenegalSerbiaSeychellesSierra LeoneSingaporeSint Maarten (Dutch part)Slovak RepublicSloveniaSmall statesSolomon IslandsSouth AfricaSouth AsiaSouth Asia (IDA & IBRD)South SudanSpainSri LankaSt. Kitts and NevisSt. LuciaSt. Vincent and the GrenadinesSub-Saharan Africa Sub-Saharan Africa (excluding high income)Sub-Saharan Africa (IDA & IBRD countries)SudanSurinameSwazilandSwedenSwitzerlandSyrian Arab RepublicTajikistanTanzaniaThailandTimor-LesteTogoTongaTrinidad and TobagoTunisiaTurkeyTuvaluUgandaUkraineUnited KingdomUnited StatesUpper middle incomeUruguayVanuatuVenezuela, RBWest Bank and GazaWorldYemen, Rep.ZambiaZimbabwe Timeline:
This timeline shows a graph from 1978 to 2014 of Grenada. No data until 1977. Number of actual observations by date: 37.
Source name:
World Development Indicators
Source organization:
International Monetary Fund, Balance of Payments Statistics Yearbook and data files.
Categories, topics:
Private Sector, Trade
Last updated:
apr 23, 2017
Indicators value changes by year
Maximum:
47.735
jan 1, 2003
At the date of observation
Value
Absolute change
Change from previous value
jan 1, 1978
6.894
+6.894
0.0%
jan 1, 1979
0.0
-6.894
-100.0%
jan 1, 1980
32.21
+32.21
-56664.36 trl%
jan 1, 1981
14.458
-17.752
-55.11%
jan 1, 1982
20.913
+6.455
44.65%
jan 1, 1983
38.563
+17.65
84.4%
jan 1, 1984
27.177
-11.386
-29.53%
jan 1, 1985
39.178
+12.001
44.16%
jan 1, 1986
37.083
-2.095
-5.35%
jan 1, 1987
14.59
-22.492
-60.65%
jan 1, 1988
13.796
-0.794
-5.44%
jan 1, 1989
16.329
+2.534
18.37%
jan 1, 1990
18.206
+1.876
11.49%
jan 1, 1991
19.386
+1.18
6.48%
jan 1, 1992
18.416
-0.97
-5.0%
jan 1, 1993
24.172
+5.756
31.25%
jan 1, 1994
22.594
-1.578
-6.53%
jan 1, 1995
25.498
+2.904
12.85%
jan 1, 1996
24.363
-1.135
-4.45%
jan 1, 1997
23.813
-0.549
-2.25%
jan 1, 1998
29.766
+5.953
25.0%
jan 1, 1999
30.971
+1.204
4.05%
jan 1, 2000
43.862
+12.892
41.63%
jan 1, 2001
41.114
-2.748
-6.27%
jan 1, 2002
41.341
+0.226
0.55%
jan 1, 2003
47.735
+6.394
15.47%
jan 1, 2004
26.775
-20.96
-43.91%
jan 1, 2005
26.919
+0.144
0.54%
jan 1, 2006
19.124
-7.795
-28.96%
jan 1, 2007
21.237
+2.112
11.05%
jan 1, 2008
19.458
-1.779
-8.38%
jan 1, 2009
23.594
+4.136
21.26%
jan 1, 2010
25.285
+1.691
7.17%
jan 1, 2011
21.52
-3.765
-14.89%
jan 1, 2012
21.315
-0.205
-0.95%
jan 1, 2013
19.67
-1.645
-7.72%
jan 1, 2014
19.679
+0.009
0.05%
Ranking of countries by current statistics by years


Comments: