29
/
en
AIzaSyAYiBZKx7MnpbEhh9jyipgxe19OcubqV5w
April 1, 2024
239091
Sierra Leone
SLE
true
2
1
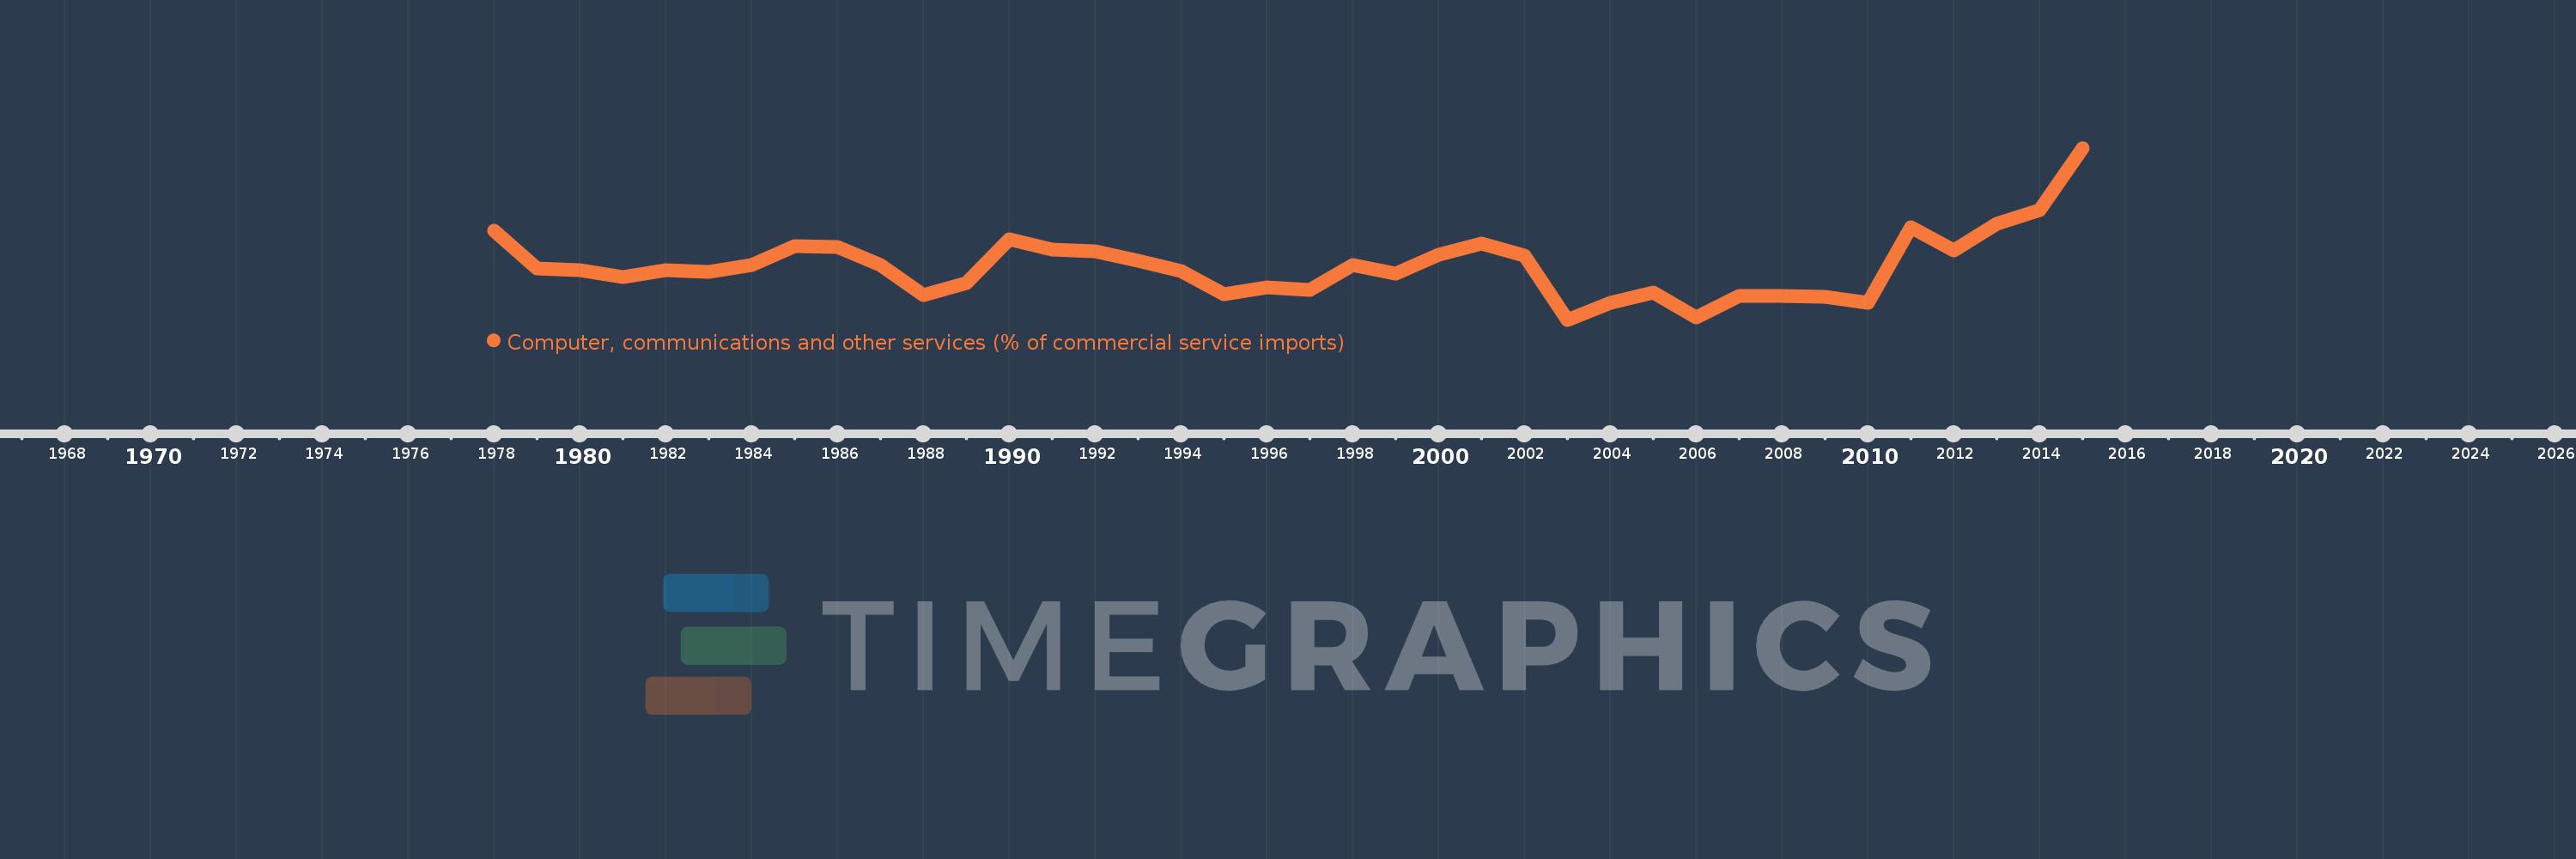
Computer, communications and other services (% of commercial service imports)
2015,2014,2013,2012,2011,2010,2009,2008,2007,2006,2005,2004,2003,2002,2001,2000,1999,1998,1997,1996,1995,1994,1993,1992,1991,1990,1989,1988,1987,1986,1985,1984,1983,1982,1981,1980,1979,1978
This statistics in other country:
AfghanistanAlbaniaAlgeriaAngolaAntigua and BarbudaArab WorldArgentinaArmeniaArubaAustraliaAustriaAzerbaijanBahamas, TheBahrainBangladeshBarbadosBelarusBelgiumBelizeBeninBermudaBhutanBoliviaBosnia and HerzegovinaBotswanaBrazilBrunei DarussalamBulgariaBurkina FasoBurundiCabo VerdeCambodiaCameroonCanadaCaribbean small statesCentral African RepublicCentral Europe and the BalticsChadChileChinaColombiaComorosCongo, Dem. Rep.Congo, Rep.Costa RicaCote d'IvoireCroatiaCuracaoCyprusCzech RepublicDenmarkDjiboutiDominicaDominican RepublicEarly-demographic dividendEast Asia & PacificEast Asia & Pacific (excluding high income)East Asia & Pacific (IDA & IBRD countries)EcuadorEgypt, Arab Rep.El SalvadorEquatorial GuineaEritreaEstoniaEthiopiaEuro areaEurope & Central AsiaEurope & Central Asia (excluding high income)Europe & Central Asia (IDA & IBRD countries)European UnionFaroe IslandsFijiFinlandFragile and conflict affected situationsFranceFrench PolynesiaGabonGambia, TheGeorgiaGermanyGhanaGreeceGrenadaGuatemalaGuineaGuinea-BissauGuyanaHaitiHeavily indebted poor countries (HIPC)High incomeHondurasHong Kong SAR, ChinaHungaryIBRD onlyIcelandIDA & IBRD totalIDA onlyIDA totalIndiaIndonesiaIran, Islamic Rep.IraqIrelandIsraelItalyJamaicaJapanJordanKazakhstanKenyaKiribatiKorea, Rep.KosovoKuwaitKyrgyz RepublicLao PDRLate-demographic dividendLatin America & Caribbean Latin America & Caribbean (excluding high income)Latin America & the Caribbean (IDA & IBRD countries)LatviaLeast developed countries: UN classificationLebanonLesothoLiberiaLibyaLithuaniaLow & middle incomeLow incomeLower middle incomeLuxembourgMacao SAR, ChinaMacedonia, FYRMadagascarMalawiMalaysiaMaldivesMaliMaltaMarshall IslandsMauritaniaMauritiusMexicoMicronesia, Fed. Sts.Middle East & North AfricaMiddle East & North Africa (excluding high income)Middle East & North Africa (IDA & IBRD countries)Middle incomeMoldovaMongoliaMontenegroMoroccoMozambiqueMyanmarNamibiaNepalNetherlandsNew CaledoniaNew ZealandNicaraguaNigerNigeriaNorth AmericaNorwayOECD membersOmanOther small statesPacific island small statesPakistanPalauPanamaPapua New GuineaParaguayPeruPhilippinesPolandPortugalPost-demographic dividendPre-demographic dividendQatarRomaniaRussian FederationRwandaSamoaSao Tome and PrincipeSaudi ArabiaSenegalSerbiaSeychellesSierra LeoneSingaporeSint Maarten (Dutch part)Slovak RepublicSloveniaSmall statesSolomon IslandsSouth AfricaSouth AsiaSouth Asia (IDA & IBRD)South SudanSpainSri LankaSt. Kitts and NevisSt. LuciaSt. Vincent and the GrenadinesSub-Saharan Africa Sub-Saharan Africa (excluding high income)Sub-Saharan Africa (IDA & IBRD countries)SudanSurinameSwazilandSwedenSwitzerlandSyrian Arab RepublicTajikistanTanzaniaThailandTimor-LesteTogoTongaTrinidad and TobagoTunisiaTurkeyTuvaluUgandaUkraineUnited KingdomUnited StatesUpper middle incomeUruguayVanuatuVenezuela, RBWest Bank and GazaWorldYemen, Rep.ZambiaZimbabwe Timeline:
This timeline shows a graph from 1978 to 2015 of Sierra Leone. No data until 1977. Number of actual observations by date: 38.
Source name:
World Development Indicators
Source organization:
International Monetary Fund, Balance of Payments Statistics Yearbook and data files.
Categories, topics:
Private Sector, Trade
Last updated:
apr 23, 2017
Indicators value changes by year
Maximum:
77.969
jan 1, 2015
At the date of observation
Value
Absolute change
Change from previous value
jan 1, 1978
41.651
+41.651
0.0%
jan 1, 1979
24.678
-16.973
-40.75%
jan 1, 1980
24.161
-0.517
-2.09%
jan 1, 1981
21.059
-3.102
-12.84%
jan 1, 1982
24.138
+3.079
14.62%
jan 1, 1983
23.41
-0.728
-3.02%
jan 1, 1984
26.42
+3.01
12.86%
jan 1, 1985
34.786
+8.366
31.67%
jan 1, 1986
34.213
-0.573
-1.65%
jan 1, 1987
26.507
-7.706
-22.52%
jan 1, 1988
12.969
-13.538
-51.07%
jan 1, 1989
18.367
+5.398
41.63%
jan 1, 1990
37.64
+19.273
104.93%
jan 1, 1991
33.016
-4.624
-12.29%
jan 1, 1992
32.402
-0.614
-1.86%
jan 1, 1993
28.11
-4.293
-13.25%
jan 1, 1994
23.658
-4.452
-15.84%
jan 1, 1995
13.352
-10.306
-43.56%
jan 1, 1996
16.297
+2.945
22.06%
jan 1, 1997
15.396
-0.9
-5.52%
jan 1, 1998
26.335
+10.938
71.04%
jan 1, 1999
22.466
-3.869
-14.69%
jan 1, 2000
30.806
+8.341
37.13%
jan 1, 2001
35.877
+5.071
16.46%
jan 1, 2002
30.354
-5.523
-15.39%
jan 1, 2003
2.188
-28.166
-92.79%
jan 1, 2004
9.465
+7.277
332.51%
jan 1, 2005
14.162
+4.697
49.62%
jan 1, 2006
3.232
-10.93
-77.18%
jan 1, 2007
12.635
+9.402
290.89%
jan 1, 2008
12.525
-0.11
-0.87%
jan 1, 2009
12.189
-0.336
-2.68%
jan 1, 2010
9.675
-2.514
-20.63%
jan 1, 2011
42.976
+33.301
344.21%
jan 1, 2012
32.856
-10.119
-23.55%
jan 1, 2013
44.533
+11.676
35.54%
jan 1, 2014
50.721
+6.189
13.9%
jan 1, 2015
77.969
+27.248
53.72%
Ranking of countries by current statistics by years


Comments: