29
/
en
AIzaSyAYiBZKx7MnpbEhh9jyipgxe19OcubqV5w
April 1, 2024
232041
Samoa
WSM
true
2
1
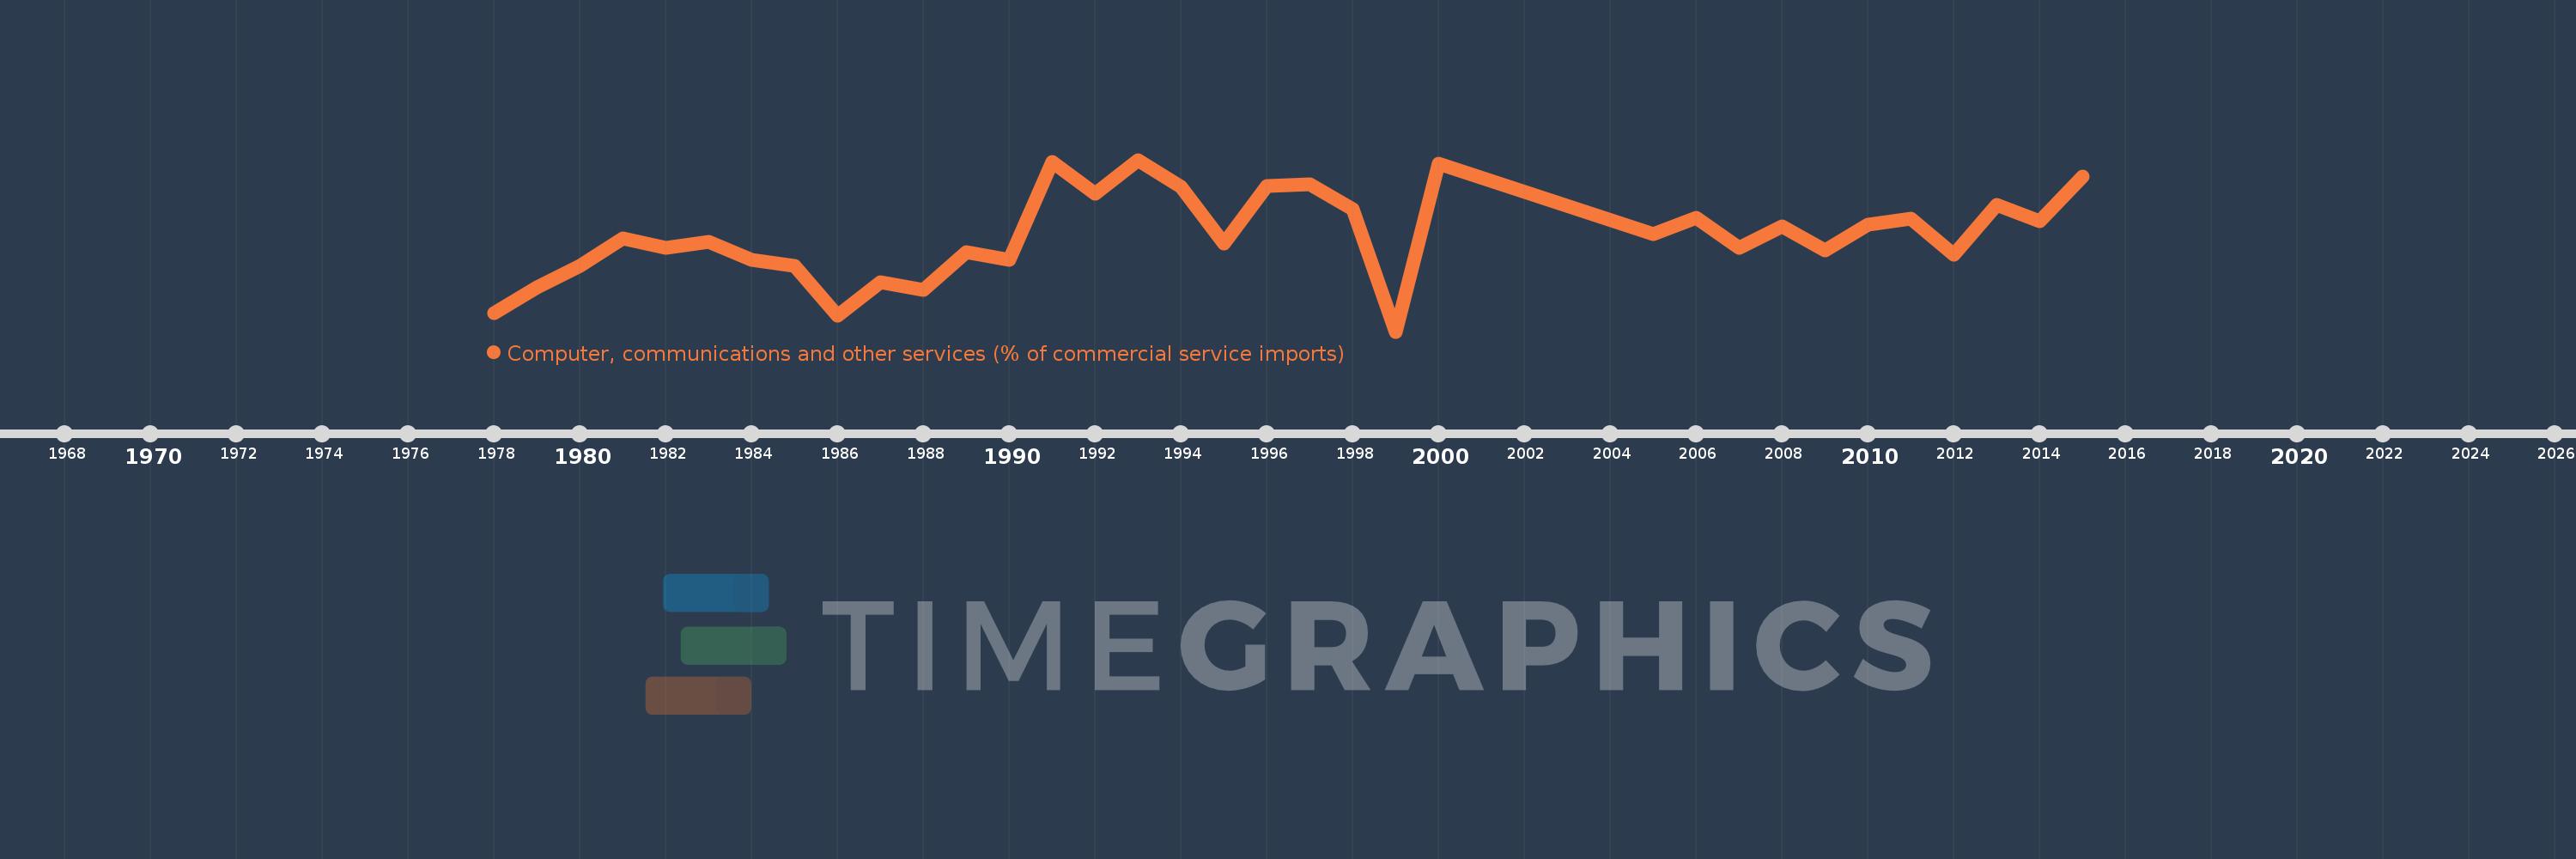
Computer, communications and other services (% of commercial service imports)
2015,2014,2013,2012,2011,2010,2009,2008,2007,2006,2005,2000,1999,1998,1997,1996,1995,1994,1993,1992,1991,1990,1989,1988,1987,1986,1985,1984,1983,1982,1981,1980,1979,1978
This statistics in other country:
AfghanistanAlbaniaAlgeriaAngolaAntigua and BarbudaArab WorldArgentinaArmeniaArubaAustraliaAustriaAzerbaijanBahamas, TheBahrainBangladeshBarbadosBelarusBelgiumBelizeBeninBermudaBhutanBoliviaBosnia and HerzegovinaBotswanaBrazilBrunei DarussalamBulgariaBurkina FasoBurundiCabo VerdeCambodiaCameroonCanadaCaribbean small statesCentral African RepublicCentral Europe and the BalticsChadChileChinaColombiaComorosCongo, Dem. Rep.Congo, Rep.Costa RicaCote d'IvoireCroatiaCuracaoCyprusCzech RepublicDenmarkDjiboutiDominicaDominican RepublicEarly-demographic dividendEast Asia & PacificEast Asia & Pacific (excluding high income)East Asia & Pacific (IDA & IBRD countries)EcuadorEgypt, Arab Rep.El SalvadorEquatorial GuineaEritreaEstoniaEthiopiaEuro areaEurope & Central AsiaEurope & Central Asia (excluding high income)Europe & Central Asia (IDA & IBRD countries)European UnionFaroe IslandsFijiFinlandFragile and conflict affected situationsFranceFrench PolynesiaGabonGambia, TheGeorgiaGermanyGhanaGreeceGrenadaGuatemalaGuineaGuinea-BissauGuyanaHaitiHeavily indebted poor countries (HIPC)High incomeHondurasHong Kong SAR, ChinaHungaryIBRD onlyIcelandIDA & IBRD totalIDA onlyIDA totalIndiaIndonesiaIran, Islamic Rep.IraqIrelandIsraelItalyJamaicaJapanJordanKazakhstanKenyaKiribatiKorea, Rep.KosovoKuwaitKyrgyz RepublicLao PDRLate-demographic dividendLatin America & Caribbean Latin America & Caribbean (excluding high income)Latin America & the Caribbean (IDA & IBRD countries)LatviaLeast developed countries: UN classificationLebanonLesothoLiberiaLibyaLithuaniaLow & middle incomeLow incomeLower middle incomeLuxembourgMacao SAR, ChinaMacedonia, FYRMadagascarMalawiMalaysiaMaldivesMaliMaltaMarshall IslandsMauritaniaMauritiusMexicoMicronesia, Fed. Sts.Middle East & North AfricaMiddle East & North Africa (excluding high income)Middle East & North Africa (IDA & IBRD countries)Middle incomeMoldovaMongoliaMontenegroMoroccoMozambiqueMyanmarNamibiaNepalNetherlandsNew CaledoniaNew ZealandNicaraguaNigerNigeriaNorth AmericaNorwayOECD membersOmanOther small statesPacific island small statesPakistanPalauPanamaPapua New GuineaParaguayPeruPhilippinesPolandPortugalPost-demographic dividendPre-demographic dividendQatarRomaniaRussian FederationRwandaSamoaSao Tome and PrincipeSaudi ArabiaSenegalSerbiaSeychellesSierra LeoneSingaporeSint Maarten (Dutch part)Slovak RepublicSloveniaSmall statesSolomon IslandsSouth AfricaSouth AsiaSouth Asia (IDA & IBRD)South SudanSpainSri LankaSt. Kitts and NevisSt. LuciaSt. Vincent and the GrenadinesSub-Saharan Africa Sub-Saharan Africa (excluding high income)Sub-Saharan Africa (IDA & IBRD countries)SudanSurinameSwazilandSwedenSwitzerlandSyrian Arab RepublicTajikistanTanzaniaThailandTimor-LesteTogoTongaTrinidad and TobagoTunisiaTurkeyTuvaluUgandaUkraineUnited KingdomUnited StatesUpper middle incomeUruguayVanuatuVenezuela, RBWest Bank and GazaWorldYemen, Rep.ZambiaZimbabwe Timeline:
This timeline shows a graph from 1978 to 2015 of Samoa. No data until 1977. Number of actual observations by date: 34.
Source name:
World Development Indicators
Source organization:
International Monetary Fund, Balance of Payments Statistics Yearbook and data files.
Categories, topics:
Private Sector, Trade
Last updated:
apr 23, 2017
Indicators value changes by year
Minimum:
11.388
jan 1, 1999
At the date of observation
Value
Absolute change
Change from previous value
jan 1, 1978
15.0
+15.0
0.0%
jan 1, 1979
20.08
+5.08
33.87%
jan 1, 1980
24.48
+4.399
21.91%
jan 1, 1981
29.94
+5.46
22.3%
jan 1, 1982
27.984
-1.956
-6.53%
jan 1, 1983
29.142
+1.159
4.14%
jan 1, 1984
25.684
-3.458
-11.87%
jan 1, 1985
24.385
-1.299
-5.06%
jan 1, 1986
14.599
-9.786
-40.13%
jan 1, 1987
21.203
+6.604
45.24%
jan 1, 1988
19.596
-1.606
-7.58%
jan 1, 1989
27.108
+7.512
38.33%
jan 1, 1990
25.611
-1.497
-5.52%
jan 1, 1991
45.0
+19.389
75.71%
jan 1, 1992
38.67
-6.33
-14.07%
jan 1, 1993
45.43
+6.76
17.48%
jan 1, 1994
40.142
-5.288
-11.64%
jan 1, 1995
28.832
-11.311
-28.18%
jan 1, 1996
40.254
+11.422
39.62%
jan 1, 1997
40.554
+0.3
0.75%
jan 1, 1998
35.636
-4.918
-12.13%
jan 1, 1999
11.388
-24.247
-68.04%
jan 1, 2000
44.608
+33.22
291.7%
jan 1, 2005
30.717
-13.891
-31.14%
jan 1, 2006
34.001
+3.284
10.69%
jan 1, 2007
28.014
-5.987
-17.61%
jan 1, 2008
32.301
+4.287
15.3%
jan 1, 2009
27.474
-4.827
-14.94%
jan 1, 2010
32.575
+5.101
18.57%
jan 1, 2011
33.767
+1.192
3.66%
jan 1, 2012
26.552
-7.215
-21.37%
jan 1, 2013
36.559
+10.008
37.69%
jan 1, 2014
33.202
-3.358
-9.18%
jan 1, 2015
42.07
+8.868
26.71%
Ranking of countries by current statistics by years


Comments: