29
/
en
AIzaSyAYiBZKx7MnpbEhh9jyipgxe19OcubqV5w
April 1, 2024
240292
Singapore
SGP
true
2
1
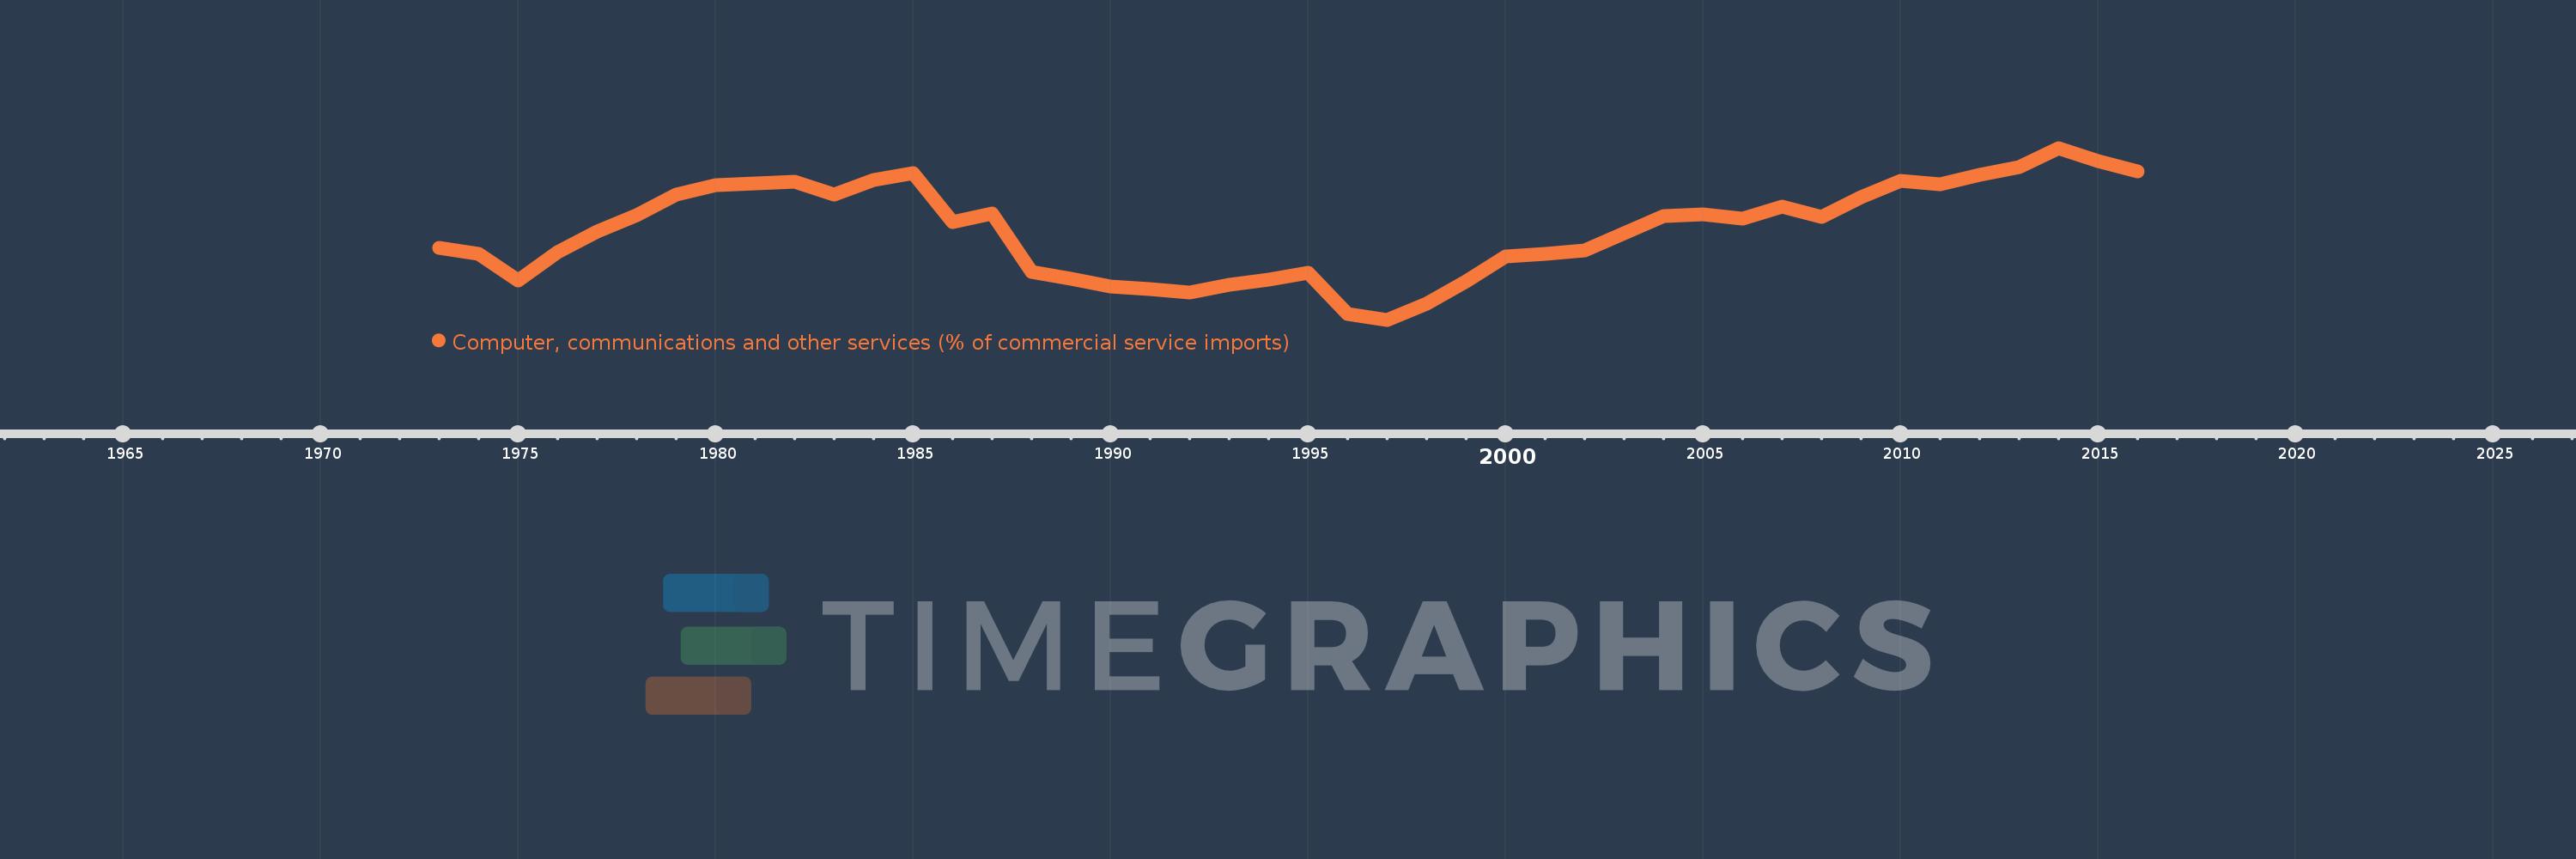
Computer, communications and other services (% of commercial service imports)
2016,2015,2014,2013,2012,2011,2010,2009,2008,2007,2006,2005,2004,2003,2002,2001,2000,1999,1998,1997,1996,1995,1994,1993,1992,1991,1990,1989,1988,1987,1986,1985,1984,1983,1982,1981,1980,1979,1978,1977,1976,1975,1974,1973
This statistics in other country:
AfghanistanAlbaniaAlgeriaAngolaAntigua and BarbudaArab WorldArgentinaArmeniaArubaAustraliaAustriaAzerbaijanBahamas, TheBahrainBangladeshBarbadosBelarusBelgiumBelizeBeninBermudaBhutanBoliviaBosnia and HerzegovinaBotswanaBrazilBrunei DarussalamBulgariaBurkina FasoBurundiCabo VerdeCambodiaCameroonCanadaCaribbean small statesCentral African RepublicCentral Europe and the BalticsChadChileChinaColombiaComorosCongo, Dem. Rep.Congo, Rep.Costa RicaCote d'IvoireCroatiaCuracaoCyprusCzech RepublicDenmarkDjiboutiDominicaDominican RepublicEarly-demographic dividendEast Asia & PacificEast Asia & Pacific (excluding high income)East Asia & Pacific (IDA & IBRD countries)EcuadorEgypt, Arab Rep.El SalvadorEquatorial GuineaEritreaEstoniaEthiopiaEuro areaEurope & Central AsiaEurope & Central Asia (excluding high income)Europe & Central Asia (IDA & IBRD countries)European UnionFaroe IslandsFijiFinlandFragile and conflict affected situationsFranceFrench PolynesiaGabonGambia, TheGeorgiaGermanyGhanaGreeceGrenadaGuatemalaGuineaGuinea-BissauGuyanaHaitiHeavily indebted poor countries (HIPC)High incomeHondurasHong Kong SAR, ChinaHungaryIBRD onlyIcelandIDA & IBRD totalIDA onlyIDA totalIndiaIndonesiaIran, Islamic Rep.IraqIrelandIsraelItalyJamaicaJapanJordanKazakhstanKenyaKiribatiKorea, Rep.KosovoKuwaitKyrgyz RepublicLao PDRLate-demographic dividendLatin America & Caribbean Latin America & Caribbean (excluding high income)Latin America & the Caribbean (IDA & IBRD countries)LatviaLeast developed countries: UN classificationLebanonLesothoLiberiaLibyaLithuaniaLow & middle incomeLow incomeLower middle incomeLuxembourgMacao SAR, ChinaMacedonia, FYRMadagascarMalawiMalaysiaMaldivesMaliMaltaMarshall IslandsMauritaniaMauritiusMexicoMicronesia, Fed. Sts.Middle East & North AfricaMiddle East & North Africa (excluding high income)Middle East & North Africa (IDA & IBRD countries)Middle incomeMoldovaMongoliaMontenegroMoroccoMozambiqueMyanmarNamibiaNepalNetherlandsNew CaledoniaNew ZealandNicaraguaNigerNigeriaNorth AmericaNorwayOECD membersOmanOther small statesPacific island small statesPakistanPalauPanamaPapua New GuineaParaguayPeruPhilippinesPolandPortugalPost-demographic dividendPre-demographic dividendQatarRomaniaRussian FederationRwandaSamoaSao Tome and PrincipeSaudi ArabiaSenegalSerbiaSeychellesSierra LeoneSingaporeSint Maarten (Dutch part)Slovak RepublicSloveniaSmall statesSolomon IslandsSouth AfricaSouth AsiaSouth Asia (IDA & IBRD)South SudanSpainSri LankaSt. Kitts and NevisSt. LuciaSt. Vincent and the GrenadinesSub-Saharan Africa Sub-Saharan Africa (excluding high income)Sub-Saharan Africa (IDA & IBRD countries)SudanSurinameSwazilandSwedenSwitzerlandSyrian Arab RepublicTajikistanTanzaniaThailandTimor-LesteTogoTongaTrinidad and TobagoTunisiaTurkeyTuvaluUgandaUkraineUnited KingdomUnited StatesUpper middle incomeUruguayVanuatuVenezuela, RBWest Bank and GazaWorldYemen, Rep.ZambiaZimbabwe Timeline:
This timeline shows a graph from 1973 to 2016 of Singapore. No data until 1972. Number of actual observations by date: 44.
Source name:
World Development Indicators
Source organization:
International Monetary Fund, Balance of Payments Statistics Yearbook and data files.
Categories, topics:
Private Sector, Trade
Last updated:
apr 23, 2017
Indicators value changes by year
Maximum:
51.181
jan 1, 2014
At the date of observation
Value
Absolute change
Change from previous value
jan 1, 1973
35.503
+35.503
0.0%
jan 1, 1974
34.584
-0.919
-2.59%
jan 1, 1975
30.431
-4.153
-12.01%
jan 1, 1976
34.857
+4.426
14.55%
jan 1, 1977
38.075
+3.218
9.23%
jan 1, 1978
40.575
+2.501
6.57%
jan 1, 1979
43.914
+3.339
8.23%
jan 1, 1980
45.352
+1.438
3.27%
jan 1, 1981
45.653
+0.301
0.66%
jan 1, 1982
45.828
+0.175
0.38%
jan 1, 1983
43.875
-1.953
-4.26%
jan 1, 1984
46.116
+2.241
5.11%
jan 1, 1985
47.248
+1.132
2.45%
jan 1, 1986
39.596
-7.651
-16.19%
jan 1, 1987
40.849
+1.252
3.16%
jan 1, 1988
31.728
-9.121
-22.33%
jan 1, 1989
30.614
-1.113
-3.51%
jan 1, 1990
29.436
-1.178
-3.85%
jan 1, 1991
28.96
-0.476
-1.62%
jan 1, 1992
28.534
-0.426
-1.47%
jan 1, 1993
29.696
+1.162
4.07%
jan 1, 1994
30.532
+0.836
2.81%
jan 1, 1995
31.62
+1.088
3.56%
jan 1, 1996
25.142
-6.478
-20.49%
jan 1, 1997
24.2
-0.942
-3.75%
jan 1, 1998
26.673
+2.473
10.22%
jan 1, 1999
30.193
+3.52
13.2%
jan 1, 2000
34.165
+3.971
13.15%
jan 1, 2001
34.596
+0.431
1.26%
jan 1, 2002
35.058
+0.463
1.34%
jan 1, 2003
37.735
+2.677
7.63%
jan 1, 2004
40.466
+2.732
7.24%
jan 1, 2005
40.741
+0.275
0.68%
jan 1, 2006
40.046
-0.695
-1.71%
jan 1, 2007
41.96
+1.915
4.78%
jan 1, 2008
40.349
-1.611
-3.84%
jan 1, 2009
43.412
+3.063
7.59%
jan 1, 2010
45.967
+2.555
5.89%
jan 1, 2011
45.48
-0.487
-1.06%
jan 1, 2012
47.005
+1.524
3.35%
jan 1, 2013
48.234
+1.229
2.62%
jan 1, 2014
51.181
+2.947
6.11%
jan 1, 2015
49.18
-2.001
-3.91%
jan 1, 2016
47.564
-1.616
-3.29%
Ranking of countries by current statistics by years


Comments: