29
/
en
AIzaSyAYiBZKx7MnpbEhh9jyipgxe19OcubqV5w
April 1, 2024
173914
Lao PDR
LAO
true
2
1
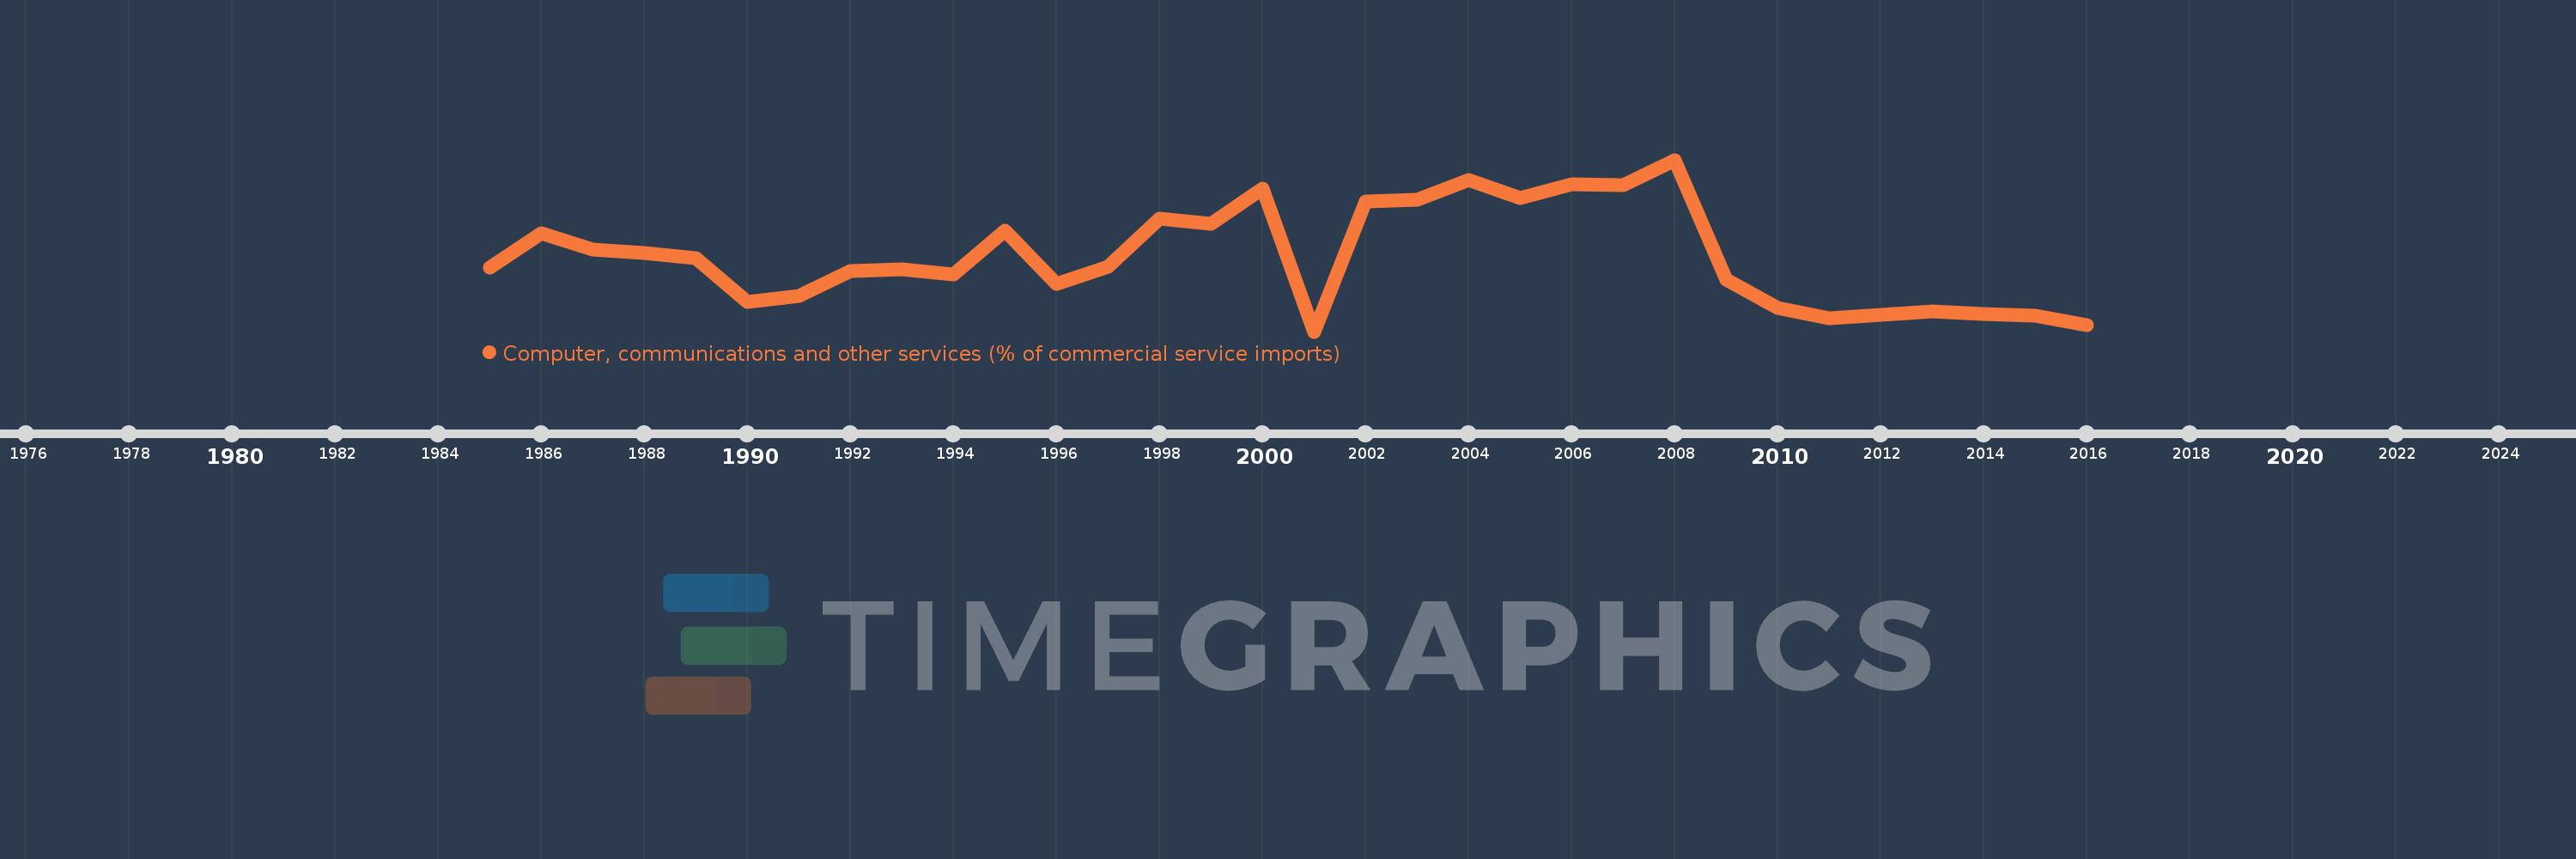
Computer, communications and other services (% of commercial service imports)
2016,2015,2014,2013,2012,2011,2010,2009,2008,2007,2006,2005,2004,2003,2002,2001,2000,1999,1998,1997,1996,1995,1994,1993,1992,1991,1990,1989,1988,1987,1986,1985
This statistics in other country:
AfghanistanAlbaniaAlgeriaAngolaAntigua and BarbudaArab WorldArgentinaArmeniaArubaAustraliaAustriaAzerbaijanBahamas, TheBahrainBangladeshBarbadosBelarusBelgiumBelizeBeninBermudaBhutanBoliviaBosnia and HerzegovinaBotswanaBrazilBrunei DarussalamBulgariaBurkina FasoBurundiCabo VerdeCambodiaCameroonCanadaCaribbean small statesCentral African RepublicCentral Europe and the BalticsChadChileChinaColombiaComorosCongo, Dem. Rep.Congo, Rep.Costa RicaCote d'IvoireCroatiaCuracaoCyprusCzech RepublicDenmarkDjiboutiDominicaDominican RepublicEarly-demographic dividendEast Asia & PacificEast Asia & Pacific (excluding high income)East Asia & Pacific (IDA & IBRD countries)EcuadorEgypt, Arab Rep.El SalvadorEquatorial GuineaEritreaEstoniaEthiopiaEuro areaEurope & Central AsiaEurope & Central Asia (excluding high income)Europe & Central Asia (IDA & IBRD countries)European UnionFaroe IslandsFijiFinlandFragile and conflict affected situationsFranceFrench PolynesiaGabonGambia, TheGeorgiaGermanyGhanaGreeceGrenadaGuatemalaGuineaGuinea-BissauGuyanaHaitiHeavily indebted poor countries (HIPC)High incomeHondurasHong Kong SAR, ChinaHungaryIBRD onlyIcelandIDA & IBRD totalIDA onlyIDA totalIndiaIndonesiaIran, Islamic Rep.IraqIrelandIsraelItalyJamaicaJapanJordanKazakhstanKenyaKiribatiKorea, Rep.KosovoKuwaitKyrgyz RepublicLao PDRLate-demographic dividendLatin America & Caribbean Latin America & Caribbean (excluding high income)Latin America & the Caribbean (IDA & IBRD countries)LatviaLeast developed countries: UN classificationLebanonLesothoLiberiaLibyaLithuaniaLow & middle incomeLow incomeLower middle incomeLuxembourgMacao SAR, ChinaMacedonia, FYRMadagascarMalawiMalaysiaMaldivesMaliMaltaMarshall IslandsMauritaniaMauritiusMexicoMicronesia, Fed. Sts.Middle East & North AfricaMiddle East & North Africa (excluding high income)Middle East & North Africa (IDA & IBRD countries)Middle incomeMoldovaMongoliaMontenegroMoroccoMozambiqueMyanmarNamibiaNepalNetherlandsNew CaledoniaNew ZealandNicaraguaNigerNigeriaNorth AmericaNorwayOECD membersOmanOther small statesPacific island small statesPakistanPalauPanamaPapua New GuineaParaguayPeruPhilippinesPolandPortugalPost-demographic dividendPre-demographic dividendQatarRomaniaRussian FederationRwandaSamoaSao Tome and PrincipeSaudi ArabiaSenegalSerbiaSeychellesSierra LeoneSingaporeSint Maarten (Dutch part)Slovak RepublicSloveniaSmall statesSolomon IslandsSouth AfricaSouth AsiaSouth Asia (IDA & IBRD)South SudanSpainSri LankaSt. Kitts and NevisSt. LuciaSt. Vincent and the GrenadinesSub-Saharan Africa Sub-Saharan Africa (excluding high income)Sub-Saharan Africa (IDA & IBRD countries)SudanSurinameSwazilandSwedenSwitzerlandSyrian Arab RepublicTajikistanTanzaniaThailandTimor-LesteTogoTongaTrinidad and TobagoTunisiaTurkeyTuvaluUgandaUkraineUnited KingdomUnited StatesUpper middle incomeUruguayVanuatuVenezuela, RBWest Bank and GazaWorldYemen, Rep.ZambiaZimbabwe Timeline:
This timeline shows a graph from 1985 to 2016 of Lao PDR. No data until 1984. Number of actual observations by date: 32.
Source name:
World Development Indicators
Source organization:
International Monetary Fund, Balance of Payments Statistics Yearbook and data files.
Categories, topics:
Private Sector, Trade
Last updated:
apr 23, 2017
Indicators value changes by year
Maximum:
98.987
jan 1, 2008
At the date of observation
Value
Absolute change
Change from previous value
jan 1, 1985
37.108
+37.108
0.0%
jan 1, 1986
56.776
+19.668
53.0%
jan 1, 1987
47.478
-9.298
-16.38%
jan 1, 1988
45.526
-1.951
-4.11%
jan 1, 1989
42.248
-3.278
-7.2%
jan 1, 1990
17.131
-25.117
-59.45%
jan 1, 1991
20.635
+3.503
20.45%
jan 1, 1992
34.839
+14.204
68.83%
jan 1, 1993
36.006
+1.167
3.35%
jan 1, 1994
32.969
-3.037
-8.44%
jan 1, 1995
58.367
+25.398
77.04%
jan 1, 1996
27.403
-30.964
-53.05%
jan 1, 1997
37.52
+10.117
36.92%
jan 1, 1998
65.109
+27.589
73.53%
jan 1, 1999
62.273
-2.837
-4.36%
jan 1, 2000
82.488
+20.215
32.46%
jan 1, 2001
0.0
-82.488
-100.0%
jan 1, 2002
74.737
+74.737
%
jan 1, 2003
76.07
+1.333
1.78%
jan 1, 2004
87.517
+11.446
15.05%
jan 1, 2005
76.835
-10.681
-12.21%
jan 1, 2006
85.042
+8.207
10.68%
jan 1, 2007
84.513
-0.529
-0.62%
jan 1, 2008
98.987
+14.474
17.13%
jan 1, 2009
30.058
-68.929
-69.63%
jan 1, 2010
13.558
-16.501
-54.9%
jan 1, 2011
7.608
-5.95
-43.89%
jan 1, 2012
9.731
+2.123
27.91%
jan 1, 2013
11.504
+1.773
18.22%
jan 1, 2014
9.984
-1.52
-13.21%
jan 1, 2015
9.081
-0.903
-9.05%
jan 1, 2016
3.855
-5.225
-57.54%
Ranking of countries by current statistics by years


Comments: