29
/
en
AIzaSyAYiBZKx7MnpbEhh9jyipgxe19OcubqV5w
April 1, 2024
277483
Uruguay
URY
true
2
1
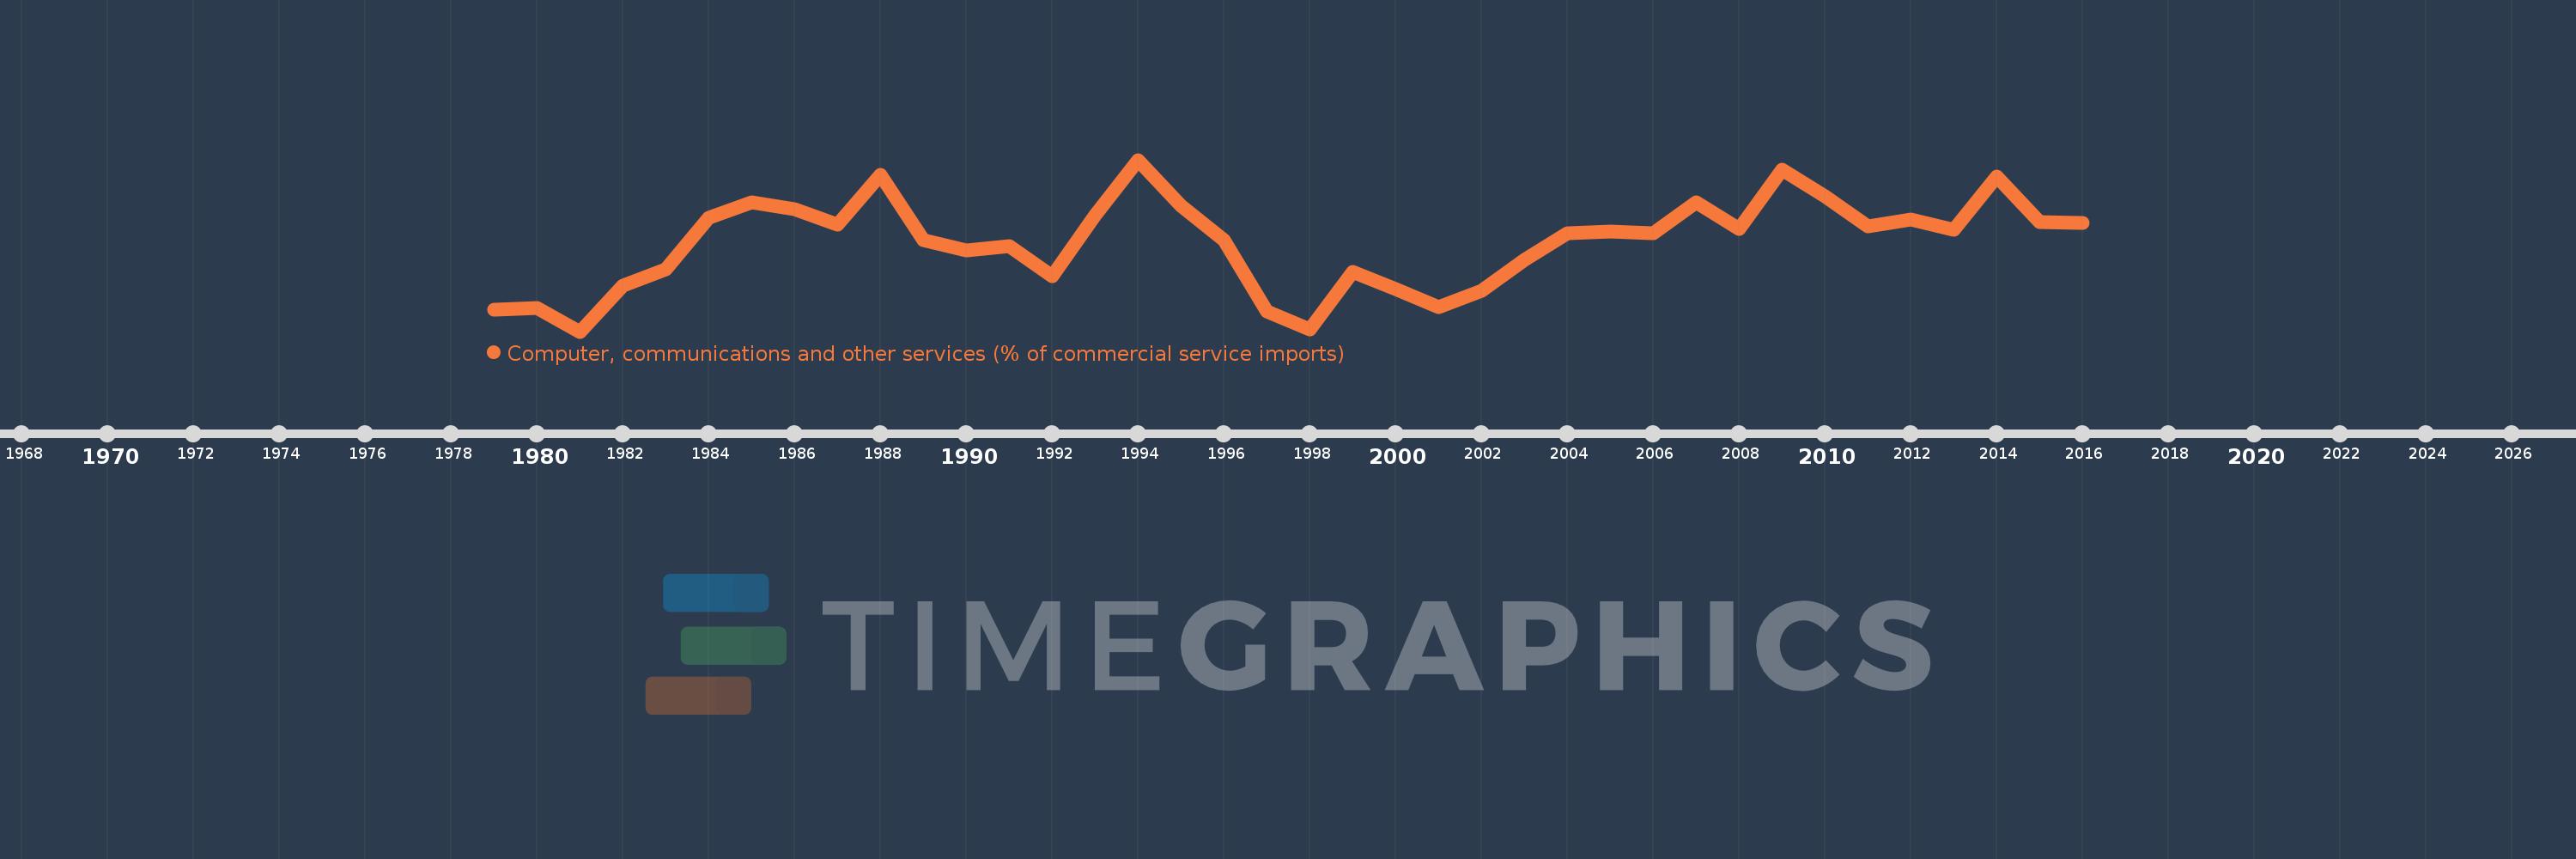
Computer, communications and other services (% of commercial service imports)
2016,2015,2014,2013,2012,2011,2010,2009,2008,2007,2006,2005,2004,2003,2002,2001,2000,1999,1998,1997,1996,1995,1994,1993,1992,1991,1990,1989,1988,1987,1986,1985,1984,1983,1982,1981,1980,1979
This statistics in other country:
AfghanistanAlbaniaAlgeriaAngolaAntigua and BarbudaArab WorldArgentinaArmeniaArubaAustraliaAustriaAzerbaijanBahamas, TheBahrainBangladeshBarbadosBelarusBelgiumBelizeBeninBermudaBhutanBoliviaBosnia and HerzegovinaBotswanaBrazilBrunei DarussalamBulgariaBurkina FasoBurundiCabo VerdeCambodiaCameroonCanadaCaribbean small statesCentral African RepublicCentral Europe and the BalticsChadChileChinaColombiaComorosCongo, Dem. Rep.Congo, Rep.Costa RicaCote d'IvoireCroatiaCuracaoCyprusCzech RepublicDenmarkDjiboutiDominicaDominican RepublicEarly-demographic dividendEast Asia & PacificEast Asia & Pacific (excluding high income)East Asia & Pacific (IDA & IBRD countries)EcuadorEgypt, Arab Rep.El SalvadorEquatorial GuineaEritreaEstoniaEthiopiaEuro areaEurope & Central AsiaEurope & Central Asia (excluding high income)Europe & Central Asia (IDA & IBRD countries)European UnionFaroe IslandsFijiFinlandFragile and conflict affected situationsFranceFrench PolynesiaGabonGambia, TheGeorgiaGermanyGhanaGreeceGrenadaGuatemalaGuineaGuinea-BissauGuyanaHaitiHeavily indebted poor countries (HIPC)High incomeHondurasHong Kong SAR, ChinaHungaryIBRD onlyIcelandIDA & IBRD totalIDA onlyIDA totalIndiaIndonesiaIran, Islamic Rep.IraqIrelandIsraelItalyJamaicaJapanJordanKazakhstanKenyaKiribatiKorea, Rep.KosovoKuwaitKyrgyz RepublicLao PDRLate-demographic dividendLatin America & Caribbean Latin America & Caribbean (excluding high income)Latin America & the Caribbean (IDA & IBRD countries)LatviaLeast developed countries: UN classificationLebanonLesothoLiberiaLibyaLithuaniaLow & middle incomeLow incomeLower middle incomeLuxembourgMacao SAR, ChinaMacedonia, FYRMadagascarMalawiMalaysiaMaldivesMaliMaltaMarshall IslandsMauritaniaMauritiusMexicoMicronesia, Fed. Sts.Middle East & North AfricaMiddle East & North Africa (excluding high income)Middle East & North Africa (IDA & IBRD countries)Middle incomeMoldovaMongoliaMontenegroMoroccoMozambiqueMyanmarNamibiaNepalNetherlandsNew CaledoniaNew ZealandNicaraguaNigerNigeriaNorth AmericaNorwayOECD membersOmanOther small statesPacific island small statesPakistanPalauPanamaPapua New GuineaParaguayPeruPhilippinesPolandPortugalPost-demographic dividendPre-demographic dividendQatarRomaniaRussian FederationRwandaSamoaSao Tome and PrincipeSaudi ArabiaSenegalSerbiaSeychellesSierra LeoneSingaporeSint Maarten (Dutch part)Slovak RepublicSloveniaSmall statesSolomon IslandsSouth AfricaSouth AsiaSouth Asia (IDA & IBRD)South SudanSpainSri LankaSt. Kitts and NevisSt. LuciaSt. Vincent and the GrenadinesSub-Saharan Africa Sub-Saharan Africa (excluding high income)Sub-Saharan Africa (IDA & IBRD countries)SudanSurinameSwazilandSwedenSwitzerlandSyrian Arab RepublicTajikistanTanzaniaThailandTimor-LesteTogoTongaTrinidad and TobagoTunisiaTurkeyTuvaluUgandaUkraineUnited KingdomUnited StatesUpper middle incomeUruguayVanuatuVenezuela, RBWest Bank and GazaWorldYemen, Rep.ZambiaZimbabwe Timeline:
This timeline shows a graph from 1979 to 2016 of Uruguay. No data until 1978. Number of actual observations by date: 38.
Source name:
World Development Indicators
Source organization:
International Monetary Fund, Balance of Payments Statistics Yearbook and data files.
Categories, topics:
Private Sector, Trade
Last updated:
apr 23, 2017
Indicators value changes by year
Minimum:
10.171
jan 1, 1981
Maximum:
29.132
jan 1, 1994
At the date of observation
Value
Absolute change
Change from previous value
jan 1, 1979
12.579
+12.579
0.0%
jan 1, 1980
12.815
+0.236
1.87%
jan 1, 1981
10.171
-2.644
-20.63%
jan 1, 1982
15.266
+5.096
50.1%
jan 1, 1983
17.016
+1.75
11.46%
jan 1, 1984
22.752
+5.736
33.71%
jan 1, 1985
24.474
+1.722
7.57%
jan 1, 1986
23.722
-0.752
-3.07%
jan 1, 1987
21.963
-1.759
-7.42%
jan 1, 1988
27.458
+5.495
25.02%
jan 1, 1989
20.232
-7.226
-26.32%
jan 1, 1990
19.123
-1.109
-5.48%
jan 1, 1991
19.636
+0.513
2.68%
jan 1, 1992
16.324
-3.313
-16.87%
jan 1, 1993
23.005
+6.681
40.93%
jan 1, 1994
29.132
+6.127
26.64%
jan 1, 1995
24.077
-5.055
-17.35%
jan 1, 1996
20.224
-3.853
-16.0%
jan 1, 1997
12.434
-7.79
-38.52%
jan 1, 1998
10.408
-2.025
-16.29%
jan 1, 1999
16.743
+6.334
60.86%
jan 1, 2000
14.891
-1.851
-11.06%
jan 1, 2001
12.903
-1.988
-13.35%
jan 1, 2002
14.667
+1.764
13.67%
jan 1, 2003
18.133
+3.466
23.63%
jan 1, 2004
21.061
+2.928
16.15%
jan 1, 2005
21.201
+0.14
0.67%
jan 1, 2006
21.062
-0.139
-0.65%
jan 1, 2007
24.402
+3.34
15.86%
jan 1, 2008
21.502
-2.9
-11.88%
jan 1, 2009
28.013
+6.51
30.28%
jan 1, 2010
25.142
-2.87
-10.25%
jan 1, 2011
21.742
-3.401
-13.53%
jan 1, 2012
22.539
+0.798
3.67%
jan 1, 2013
21.39
-1.15
-5.1%
jan 1, 2014
27.246
+5.857
27.38%
jan 1, 2015
22.218
-5.029
-18.46%
jan 1, 2016
22.166
-0.051
-0.23%
Ranking of countries by current statistics by years


Comments: