29
/
en
AIzaSyAYiBZKx7MnpbEhh9jyipgxe19OcubqV5w
April 1, 2024
29734
Euro area
EMU
false
2
1
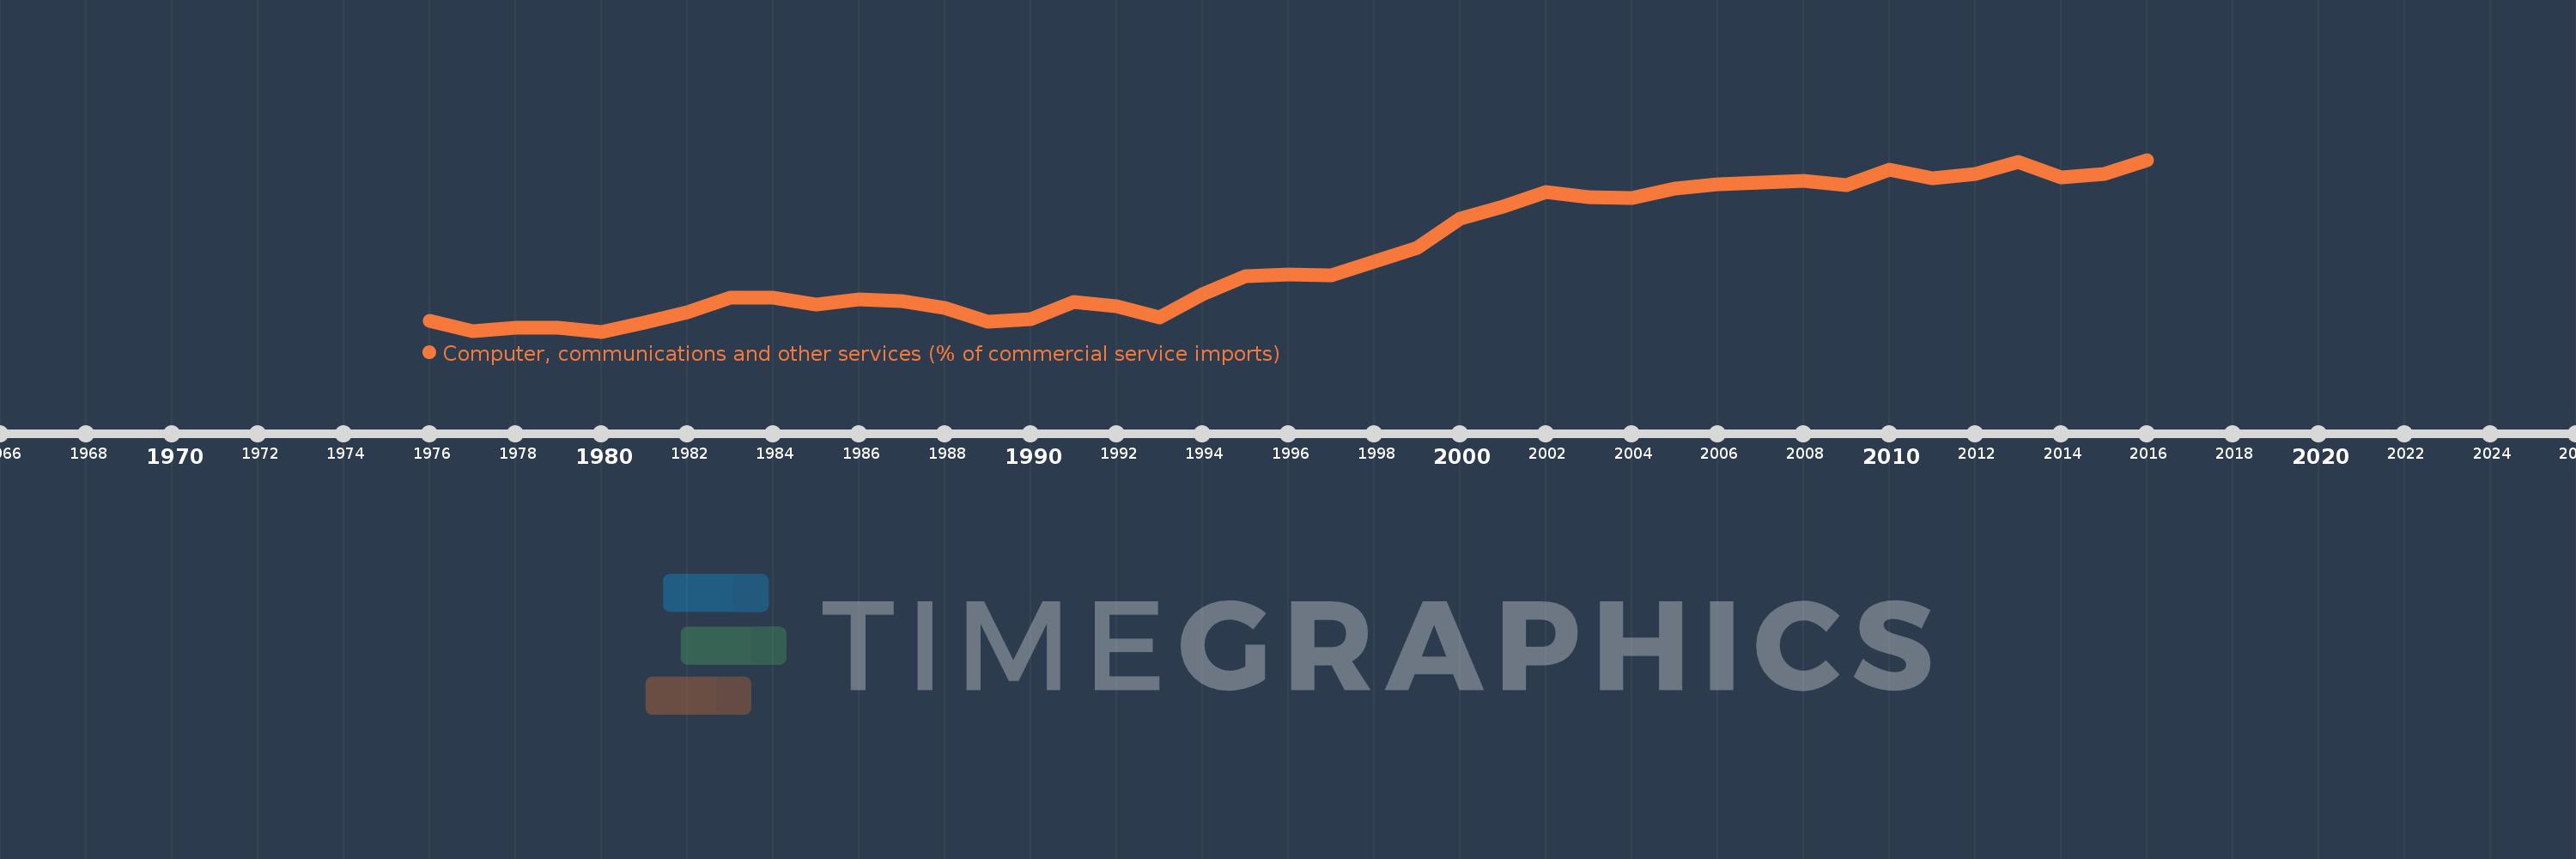
Computer, communications and other services (% of commercial service imports)
2016,2015,2014,2013,2012,2011,2010,2009,2008,2007,2006,2005,2004,2003,2002,2001,2000,1999,1998,1997,1996,1995,1994,1993,1992,1991,1990,1989,1988,1987,1986,1985,1984,1983,1982,1981,1980,1979,1978,1977,1976
This statistics in other country:
AfghanistanAlbaniaAlgeriaAngolaAntigua and BarbudaArab WorldArgentinaArmeniaArubaAustraliaAustriaAzerbaijanBahamas, TheBahrainBangladeshBarbadosBelarusBelgiumBelizeBeninBermudaBhutanBoliviaBosnia and HerzegovinaBotswanaBrazilBrunei DarussalamBulgariaBurkina FasoBurundiCabo VerdeCambodiaCameroonCanadaCaribbean small statesCentral African RepublicCentral Europe and the BalticsChadChileChinaColombiaComorosCongo, Dem. Rep.Congo, Rep.Costa RicaCote d'IvoireCroatiaCuracaoCyprusCzech RepublicDenmarkDjiboutiDominicaDominican RepublicEarly-demographic dividendEast Asia & PacificEast Asia & Pacific (excluding high income)East Asia & Pacific (IDA & IBRD countries)EcuadorEgypt, Arab Rep.El SalvadorEquatorial GuineaEritreaEstoniaEthiopiaEuro areaEurope & Central AsiaEurope & Central Asia (excluding high income)Europe & Central Asia (IDA & IBRD countries)European UnionFaroe IslandsFijiFinlandFragile and conflict affected situationsFranceFrench PolynesiaGabonGambia, TheGeorgiaGermanyGhanaGreeceGrenadaGuatemalaGuineaGuinea-BissauGuyanaHaitiHeavily indebted poor countries (HIPC)High incomeHondurasHong Kong SAR, ChinaHungaryIBRD onlyIcelandIDA & IBRD totalIDA onlyIDA totalIndiaIndonesiaIran, Islamic Rep.IraqIrelandIsraelItalyJamaicaJapanJordanKazakhstanKenyaKiribatiKorea, Rep.KosovoKuwaitKyrgyz RepublicLao PDRLate-demographic dividendLatin America & Caribbean Latin America & Caribbean (excluding high income)Latin America & the Caribbean (IDA & IBRD countries)LatviaLeast developed countries: UN classificationLebanonLesothoLiberiaLibyaLithuaniaLow & middle incomeLow incomeLower middle incomeLuxembourgMacao SAR, ChinaMacedonia, FYRMadagascarMalawiMalaysiaMaldivesMaliMaltaMarshall IslandsMauritaniaMauritiusMexicoMicronesia, Fed. Sts.Middle East & North AfricaMiddle East & North Africa (excluding high income)Middle East & North Africa (IDA & IBRD countries)Middle incomeMoldovaMongoliaMontenegroMoroccoMozambiqueMyanmarNamibiaNepalNetherlandsNew CaledoniaNew ZealandNicaraguaNigerNigeriaNorth AmericaNorwayOECD membersOmanOther small statesPacific island small statesPakistanPalauPanamaPapua New GuineaParaguayPeruPhilippinesPolandPortugalPost-demographic dividendPre-demographic dividendQatarRomaniaRussian FederationRwandaSamoaSao Tome and PrincipeSaudi ArabiaSenegalSerbiaSeychellesSierra LeoneSingaporeSint Maarten (Dutch part)Slovak RepublicSloveniaSmall statesSolomon IslandsSouth AfricaSouth AsiaSouth Asia (IDA & IBRD)South SudanSpainSri LankaSt. Kitts and NevisSt. LuciaSt. Vincent and the GrenadinesSub-Saharan Africa Sub-Saharan Africa (excluding high income)Sub-Saharan Africa (IDA & IBRD countries)SudanSurinameSwazilandSwedenSwitzerlandSyrian Arab RepublicTajikistanTanzaniaThailandTimor-LesteTogoTongaTrinidad and TobagoTunisiaTurkeyTuvaluUgandaUkraineUnited KingdomUnited StatesUpper middle incomeUruguayVanuatuVenezuela, RBWest Bank and GazaWorldYemen, Rep.ZambiaZimbabwe Timeline:
This timeline shows a graph from 1976 to 2016 of Euro area. No data until 1975. Number of actual observations by date: 41.
Source name:
World Development Indicators
Source organization:
International Monetary Fund, Balance of Payments Statistics Yearbook and data files.
Categories, topics:
Private Sector, Trade
Last updated:
apr 23, 2017
Indicators value changes by year
Minimum:
30.184
jan 1, 1980
Maximum:
50.232
jan 1, 2016
At the date of observation
Value
Absolute change
Change from previous value
jan 1, 1976
31.416
+31.416
0.0%
jan 1, 1977
30.244
-1.172
-3.73%
jan 1, 1978
30.601
+0.357
1.18%
jan 1, 1979
30.645
+0.044
0.14%
jan 1, 1980
30.184
-0.461
-1.5%
jan 1, 1981
31.215
+1.031
3.41%
jan 1, 1982
32.424
+1.209
3.87%
jan 1, 1983
34.19
+1.766
5.45%
jan 1, 1984
34.133
-0.057
-0.17%
jan 1, 1985
33.352
-0.781
-2.29%
jan 1, 1986
33.985
+0.633
1.9%
jan 1, 1987
33.779
-0.206
-0.61%
jan 1, 1988
32.923
-0.855
-2.53%
jan 1, 1989
31.34
-1.584
-4.81%
jan 1, 1990
31.624
+0.284
0.91%
jan 1, 1991
33.618
+1.994
6.31%
jan 1, 1992
33.149
-0.47
-1.4%
jan 1, 1993
31.809
-1.34
-4.04%
jan 1, 1994
34.523
+2.714
8.53%
jan 1, 1995
36.653
+2.13
6.17%
jan 1, 1996
36.839
+0.186
0.51%
jan 1, 1997
36.799
-0.04
-0.11%
jan 1, 1998
38.305
+1.506
4.09%
jan 1, 1999
39.96
+1.655
4.32%
jan 1, 2000
43.395
+3.435
8.6%
jan 1, 2001
44.746
+1.352
3.11%
jan 1, 2002
46.493
+1.747
3.9%
jan 1, 2003
45.836
-0.657
-1.41%
jan 1, 2004
45.727
-0.11
-0.24%
jan 1, 2005
46.924
+1.197
2.62%
jan 1, 2006
47.425
+0.501
1.07%
jan 1, 2007
47.544
+0.12
0.25%
jan 1, 2008
47.803
+0.259
0.54%
jan 1, 2009
47.264
-0.539
-1.13%
jan 1, 2010
49.112
+1.848
3.91%
jan 1, 2011
48.092
-1.02
-2.08%
jan 1, 2012
48.54
+0.447
0.93%
jan 1, 2013
49.973
+1.433
2.95%
jan 1, 2014
48.224
-1.749
-3.5%
jan 1, 2015
48.593
+0.369
0.77%
jan 1, 2016
50.232
+1.639
3.37%
Ranking of countries by current statistics by years


Comments: