29
/
en
AIzaSyAYiBZKx7MnpbEhh9jyipgxe19OcubqV5w
April 1, 2024
192848
Mauritania
MRT
true
2
1
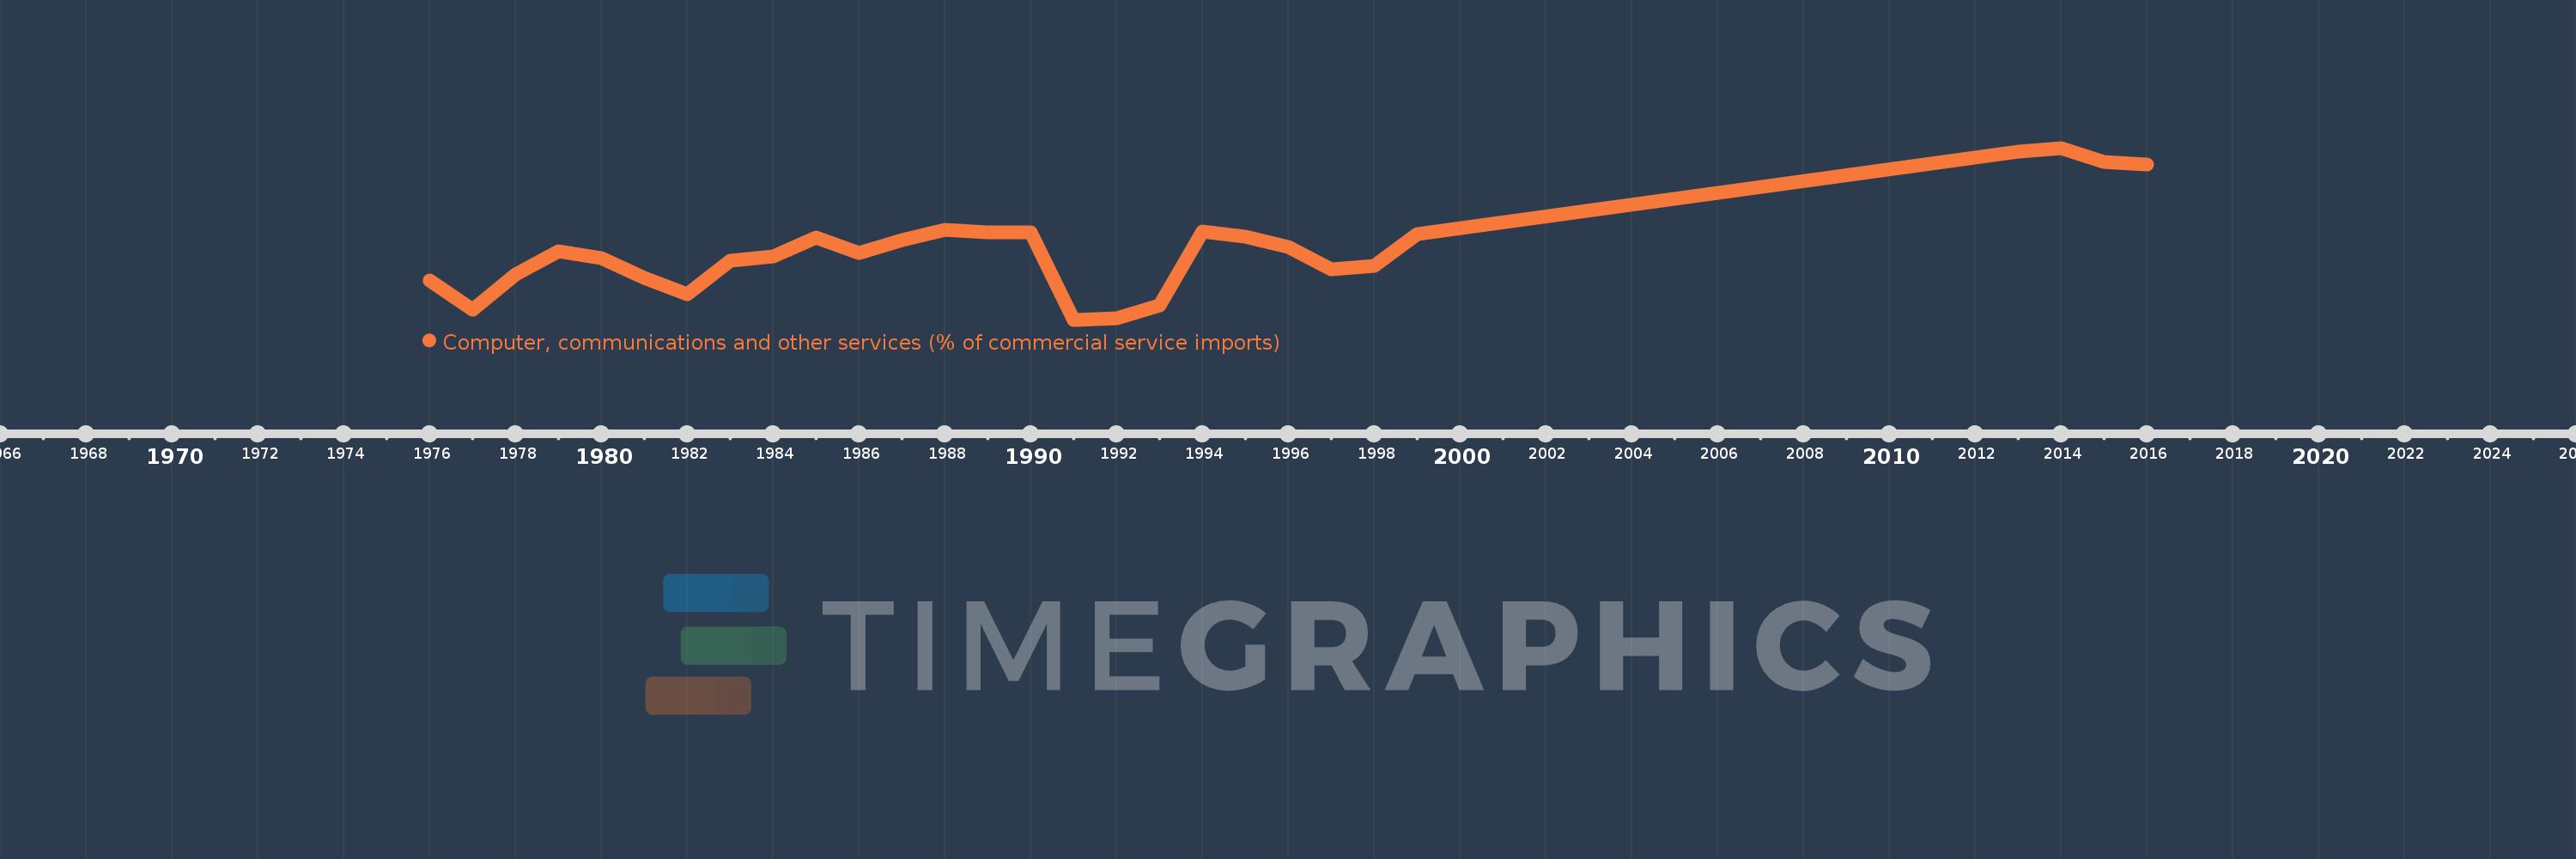
Computer, communications and other services (% of commercial service imports)
2016,2015,2014,2013,1999,1998,1997,1996,1995,1994,1993,1992,1991,1990,1989,1988,1987,1986,1985,1984,1983,1982,1981,1980,1979,1978,1977,1976
This statistics in other country:
AfghanistanAlbaniaAlgeriaAngolaAntigua and BarbudaArab WorldArgentinaArmeniaArubaAustraliaAustriaAzerbaijanBahamas, TheBahrainBangladeshBarbadosBelarusBelgiumBelizeBeninBermudaBhutanBoliviaBosnia and HerzegovinaBotswanaBrazilBrunei DarussalamBulgariaBurkina FasoBurundiCabo VerdeCambodiaCameroonCanadaCaribbean small statesCentral African RepublicCentral Europe and the BalticsChadChileChinaColombiaComorosCongo, Dem. Rep.Congo, Rep.Costa RicaCote d'IvoireCroatiaCuracaoCyprusCzech RepublicDenmarkDjiboutiDominicaDominican RepublicEarly-demographic dividendEast Asia & PacificEast Asia & Pacific (excluding high income)East Asia & Pacific (IDA & IBRD countries)EcuadorEgypt, Arab Rep.El SalvadorEquatorial GuineaEritreaEstoniaEthiopiaEuro areaEurope & Central AsiaEurope & Central Asia (excluding high income)Europe & Central Asia (IDA & IBRD countries)European UnionFaroe IslandsFijiFinlandFragile and conflict affected situationsFranceFrench PolynesiaGabonGambia, TheGeorgiaGermanyGhanaGreeceGrenadaGuatemalaGuineaGuinea-BissauGuyanaHaitiHeavily indebted poor countries (HIPC)High incomeHondurasHong Kong SAR, ChinaHungaryIBRD onlyIcelandIDA & IBRD totalIDA onlyIDA totalIndiaIndonesiaIran, Islamic Rep.IraqIrelandIsraelItalyJamaicaJapanJordanKazakhstanKenyaKiribatiKorea, Rep.KosovoKuwaitKyrgyz RepublicLao PDRLate-demographic dividendLatin America & Caribbean Latin America & Caribbean (excluding high income)Latin America & the Caribbean (IDA & IBRD countries)LatviaLeast developed countries: UN classificationLebanonLesothoLiberiaLibyaLithuaniaLow & middle incomeLow incomeLower middle incomeLuxembourgMacao SAR, ChinaMacedonia, FYRMadagascarMalawiMalaysiaMaldivesMaliMaltaMarshall IslandsMauritaniaMauritiusMexicoMicronesia, Fed. Sts.Middle East & North AfricaMiddle East & North Africa (excluding high income)Middle East & North Africa (IDA & IBRD countries)Middle incomeMoldovaMongoliaMontenegroMoroccoMozambiqueMyanmarNamibiaNepalNetherlandsNew CaledoniaNew ZealandNicaraguaNigerNigeriaNorth AmericaNorwayOECD membersOmanOther small statesPacific island small statesPakistanPalauPanamaPapua New GuineaParaguayPeruPhilippinesPolandPortugalPost-demographic dividendPre-demographic dividendQatarRomaniaRussian FederationRwandaSamoaSao Tome and PrincipeSaudi ArabiaSenegalSerbiaSeychellesSierra LeoneSingaporeSint Maarten (Dutch part)Slovak RepublicSloveniaSmall statesSolomon IslandsSouth AfricaSouth AsiaSouth Asia (IDA & IBRD)South SudanSpainSri LankaSt. Kitts and NevisSt. LuciaSt. Vincent and the GrenadinesSub-Saharan Africa Sub-Saharan Africa (excluding high income)Sub-Saharan Africa (IDA & IBRD countries)SudanSurinameSwazilandSwedenSwitzerlandSyrian Arab RepublicTajikistanTanzaniaThailandTimor-LesteTogoTongaTrinidad and TobagoTunisiaTurkeyTuvaluUgandaUkraineUnited KingdomUnited StatesUpper middle incomeUruguayVanuatuVenezuela, RBWest Bank and GazaWorldYemen, Rep.ZambiaZimbabwe Timeline:
This timeline shows a graph from 1976 to 2016 of Mauritania. No data until 1975. Number of actual observations by date: 28.
Source name:
World Development Indicators
Source organization:
International Monetary Fund, Balance of Payments Statistics Yearbook and data files.
Categories, topics:
Private Sector, Trade
Last updated:
apr 23, 2017
Indicators value changes by year
Maximum:
58.002
jan 1, 2014
At the date of observation
Value
Absolute change
Change from previous value
jan 1, 1976
14.455
+14.455
0.0%
jan 1, 1977
4.893
-9.562
-66.15%
jan 1, 1978
16.458
+11.565
236.36%
jan 1, 1979
24.082
+7.624
46.32%
jan 1, 1980
21.775
-2.306
-9.58%
jan 1, 1981
15.453
-6.322
-29.03%
jan 1, 1982
10.073
-5.381
-34.82%
jan 1, 1983
21.154
+11.081
110.01%
jan 1, 1984
22.537
+1.384
6.54%
jan 1, 1985
28.571
+6.034
26.77%
jan 1, 1986
23.578
-4.994
-17.48%
jan 1, 1987
27.921
+4.343
18.42%
jan 1, 1988
31.149
+3.228
11.56%
jan 1, 1989
30.283
-0.866
-2.78%
jan 1, 1990
30.233
-0.05
-0.17%
jan 1, 1991
1.678
-28.555
-94.45%
jan 1, 1992
2.153
+0.476
28.36%
jan 1, 1993
6.327
+4.174
193.84%
jan 1, 1994
30.479
+24.152
381.72%
jan 1, 1995
28.848
-1.631
-5.35%
jan 1, 1996
25.414
-3.434
-11.9%
jan 1, 1997
18.115
-7.298
-28.72%
jan 1, 1998
19.248
+1.132
6.25%
jan 1, 1999
29.765
+10.517
54.64%
jan 1, 2013
56.821
+27.056
90.9%
jan 1, 2014
58.002
+1.182
2.08%
jan 1, 2015
53.417
-4.585
-7.91%
jan 1, 2016
52.519
-0.898
-1.68%
Ranking of countries by current statistics by years


Comments: